Apache HertzBeat
A real-time observability system with agentless, performance cluster, prometheus-compatible, custom monitoring and status page building capabilities.





Home: hertzbeat.apache.org
🎡 Introduction
Apache HertzBeat is an easy-to-use, open source, real-time observability system with agentless, high performance cluster, prometheus-compatible, offers powerful custom monitoring and status page building capabilities.
Features
- Combines monitoring, alarm, and notification features into one platform, and supports monitoring for web service, program, database, cache, os, webserver, middleware, bigdata, cloud-native, network, custom and more.
- Easy to use and agentless, web-based and with one-click monitoring and alerting, zero learning curve.
- Makes protocols such as
Http, Jmx, Ssh, Snmp, Jdbc, Prometheusconfigurable, allowing you to collect any metrics by simply configuring the templateYMLfile online. Imagine being able to quickly adapt to a new monitoring type like K8s or Docker simply by configuring online with HertzBeat. - Compatible with the
Prometheusecosystem and more, can monitoring whatPrometheuscan monitoring with few clicks on webui. - High performance, supports horizontal expansion of multi-collector clusters, multi-isolated network monitoring and cloud-edge collaboration.
- Provides flexible alarm threshold rules and timely notifications delivered via
DiscordSlackTelegramEmailDingtalkWeChatFeiShuWebhookSMSServerChan. - Provides powerful status page building capabilities, easily communicate the real-time status of your service to users.
HertzBeat's powerful customization, multi-type support, high performance, easy expansion, and low coupling, aims to help users quickly build their own monitoring system.
Powerful Monitoring Templates
Before we discuss the customizable monitoring capabilities of HertzBeat, which we mentioned at the beginning, let's introduce the different monitoring templates of HertzBeat. And it is because of this monitoring template design that the advanced features come later.
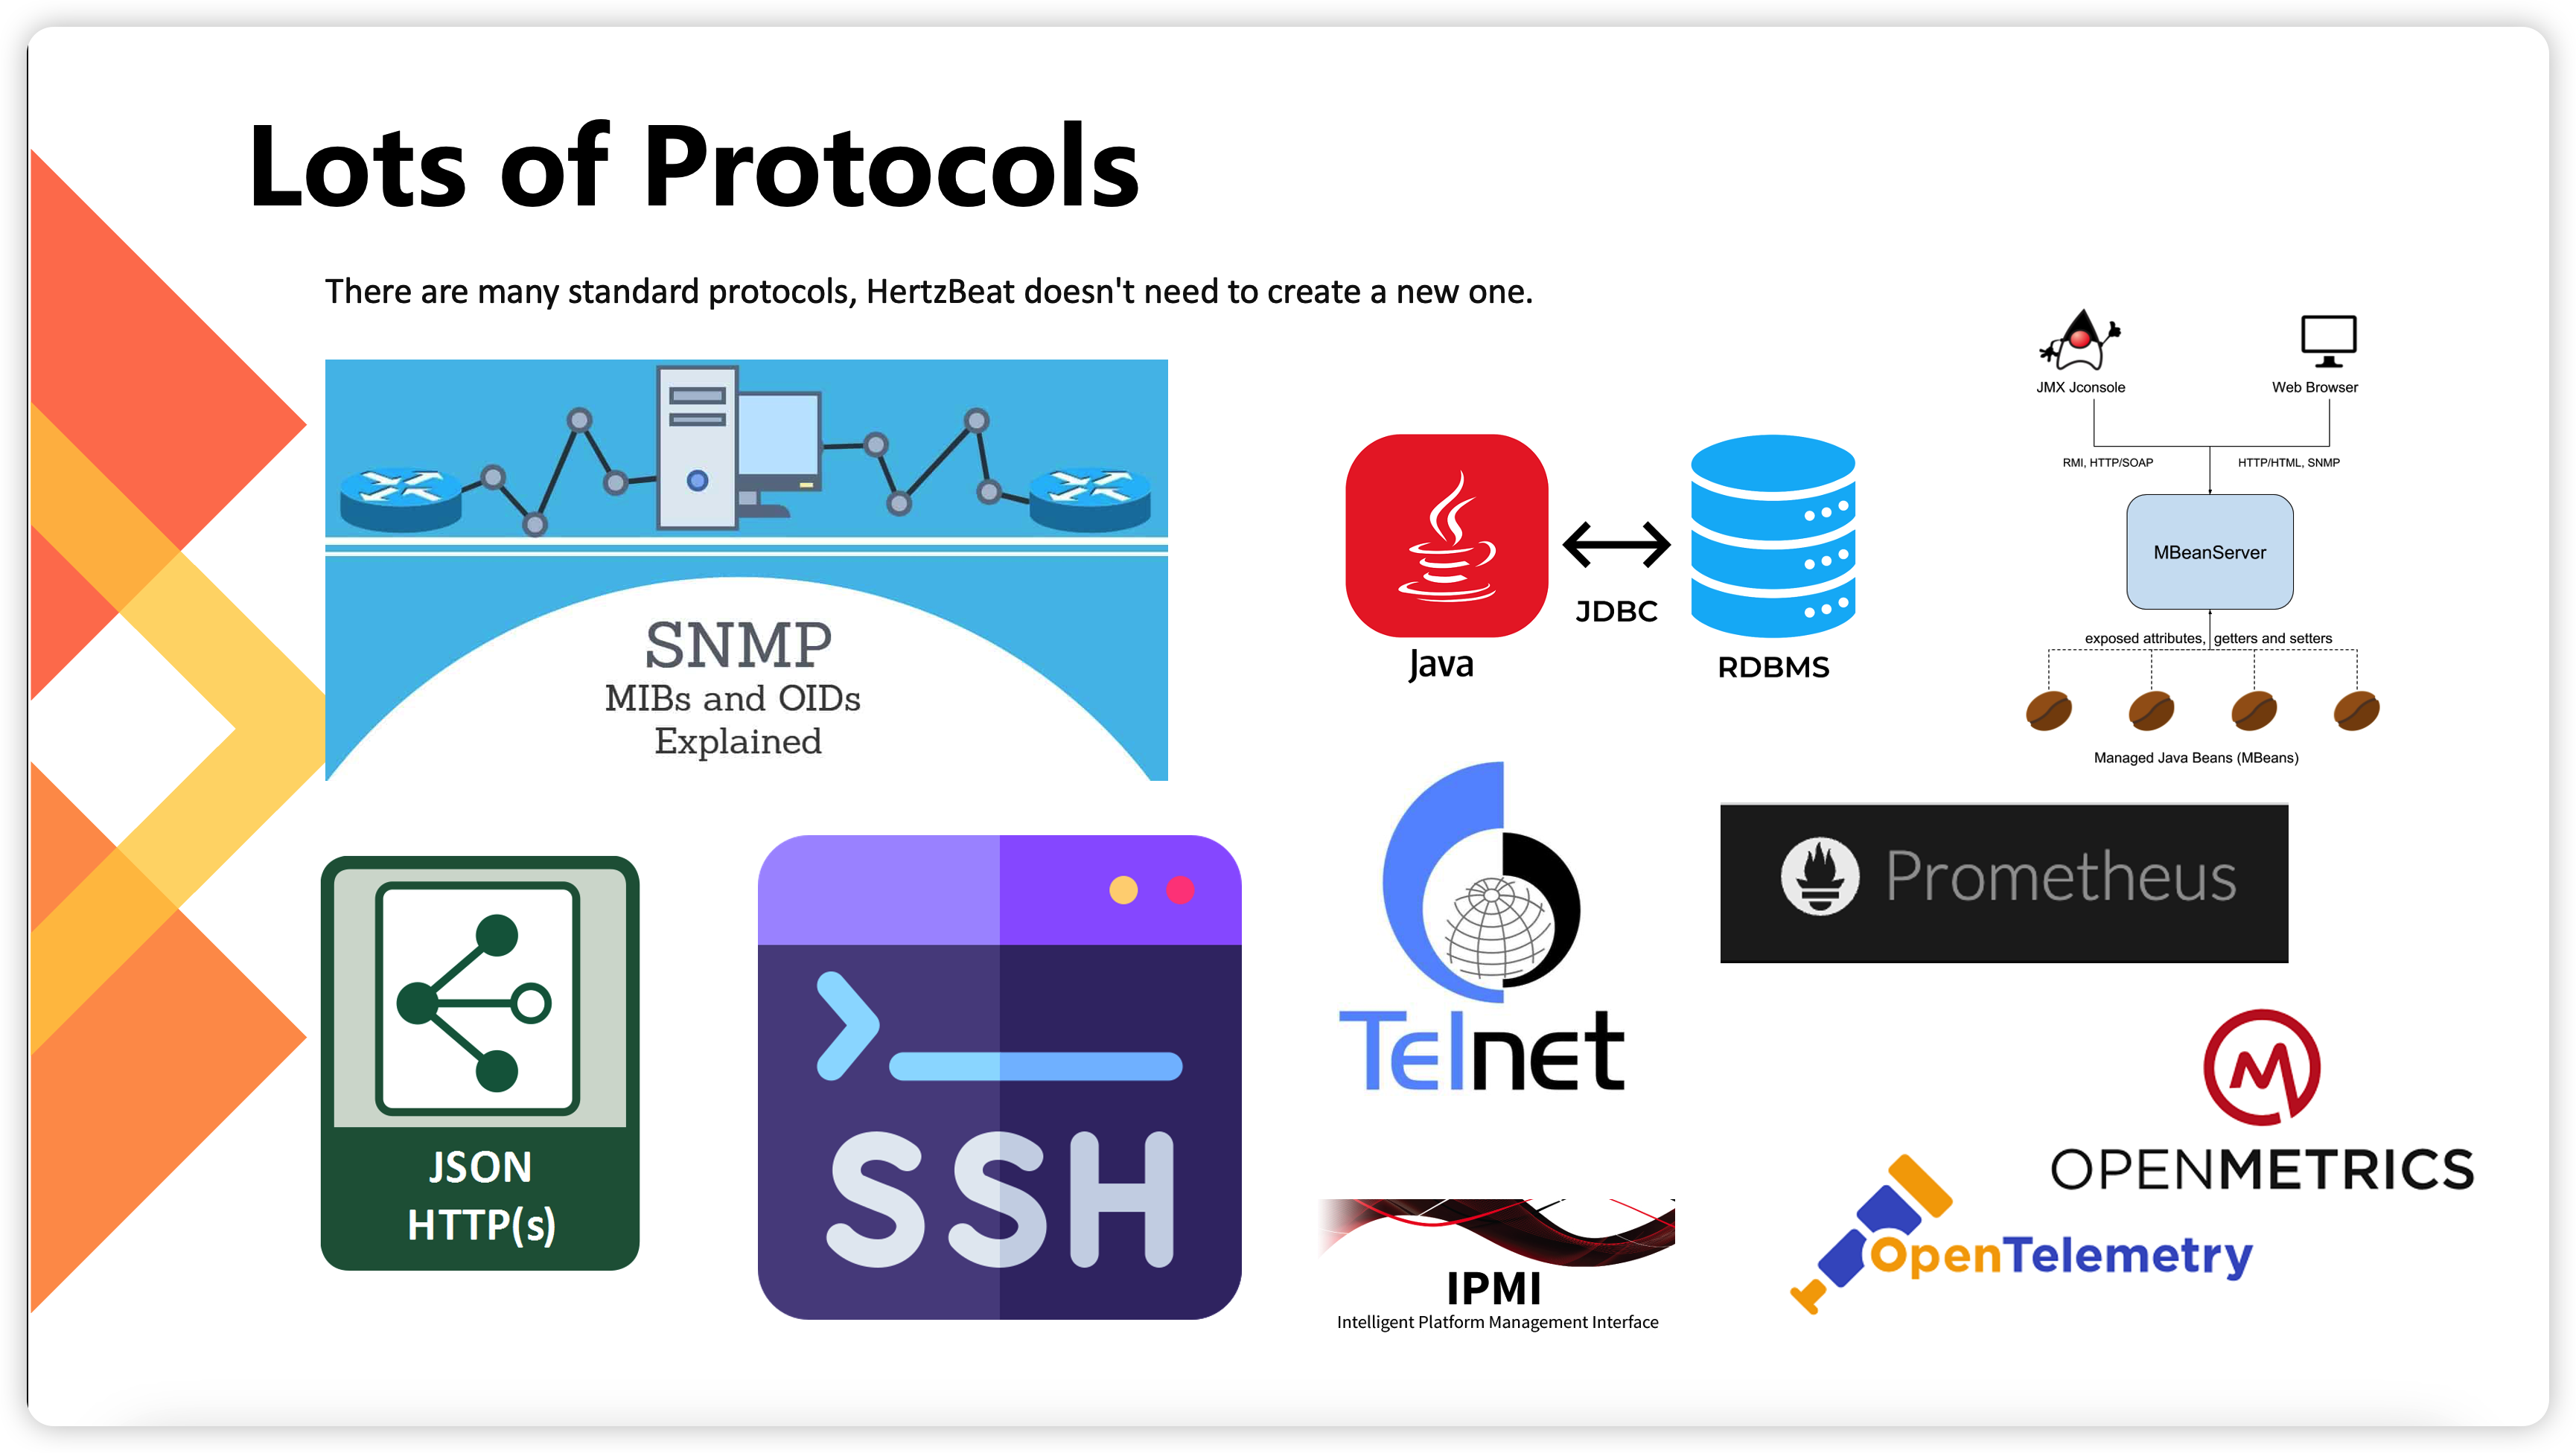
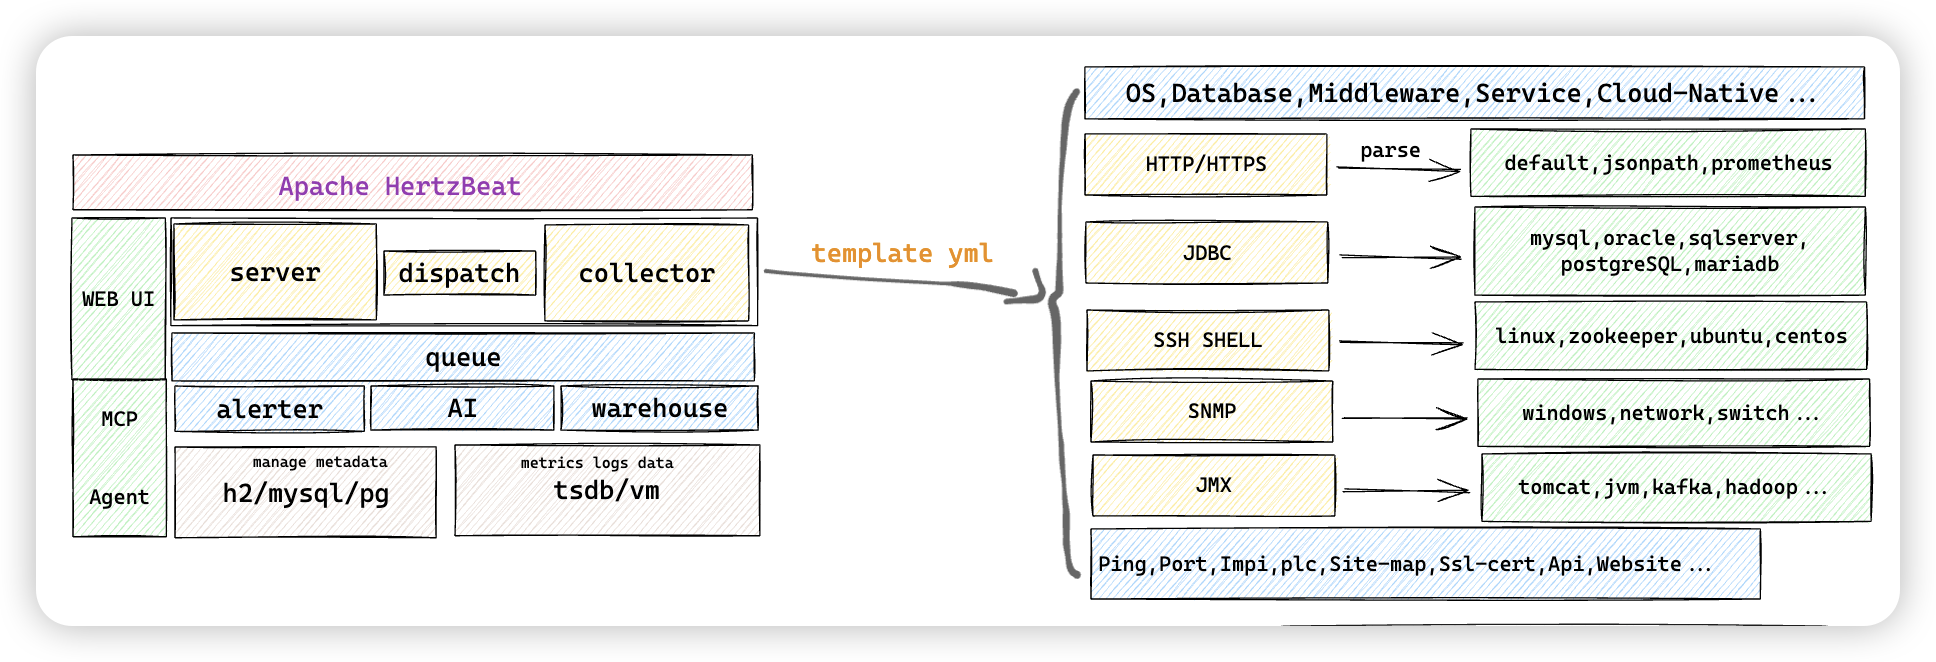
HertzBeat itself did not create a data collection protocol for the monitoring client to adapt to. Instead, HertzBeat makes full use of the existing ecosystem, SNMP protocol to collect information from network switches and routers, JMX specification to collect information from Java applications, JDBC specification to collect information from datasets, SSH to directly connect to scripts to get the display information, HTTP+ (JsonPath | prometheus, etc.) to parse the information from API interfaces, IPMI protocol to collect server information, and so on.
HertzBeat uses these existing standard protocols or specifications, makes them abstractly configurable, and finally makes them all available in the form of YML format monitoring templates that can be written to create templates that use these protocols to collect any desired metrics data.
Do you believe that users can just write a monitoring template on the UI page, click save and immediately adapt a new monitoring type like K8s or Docker?
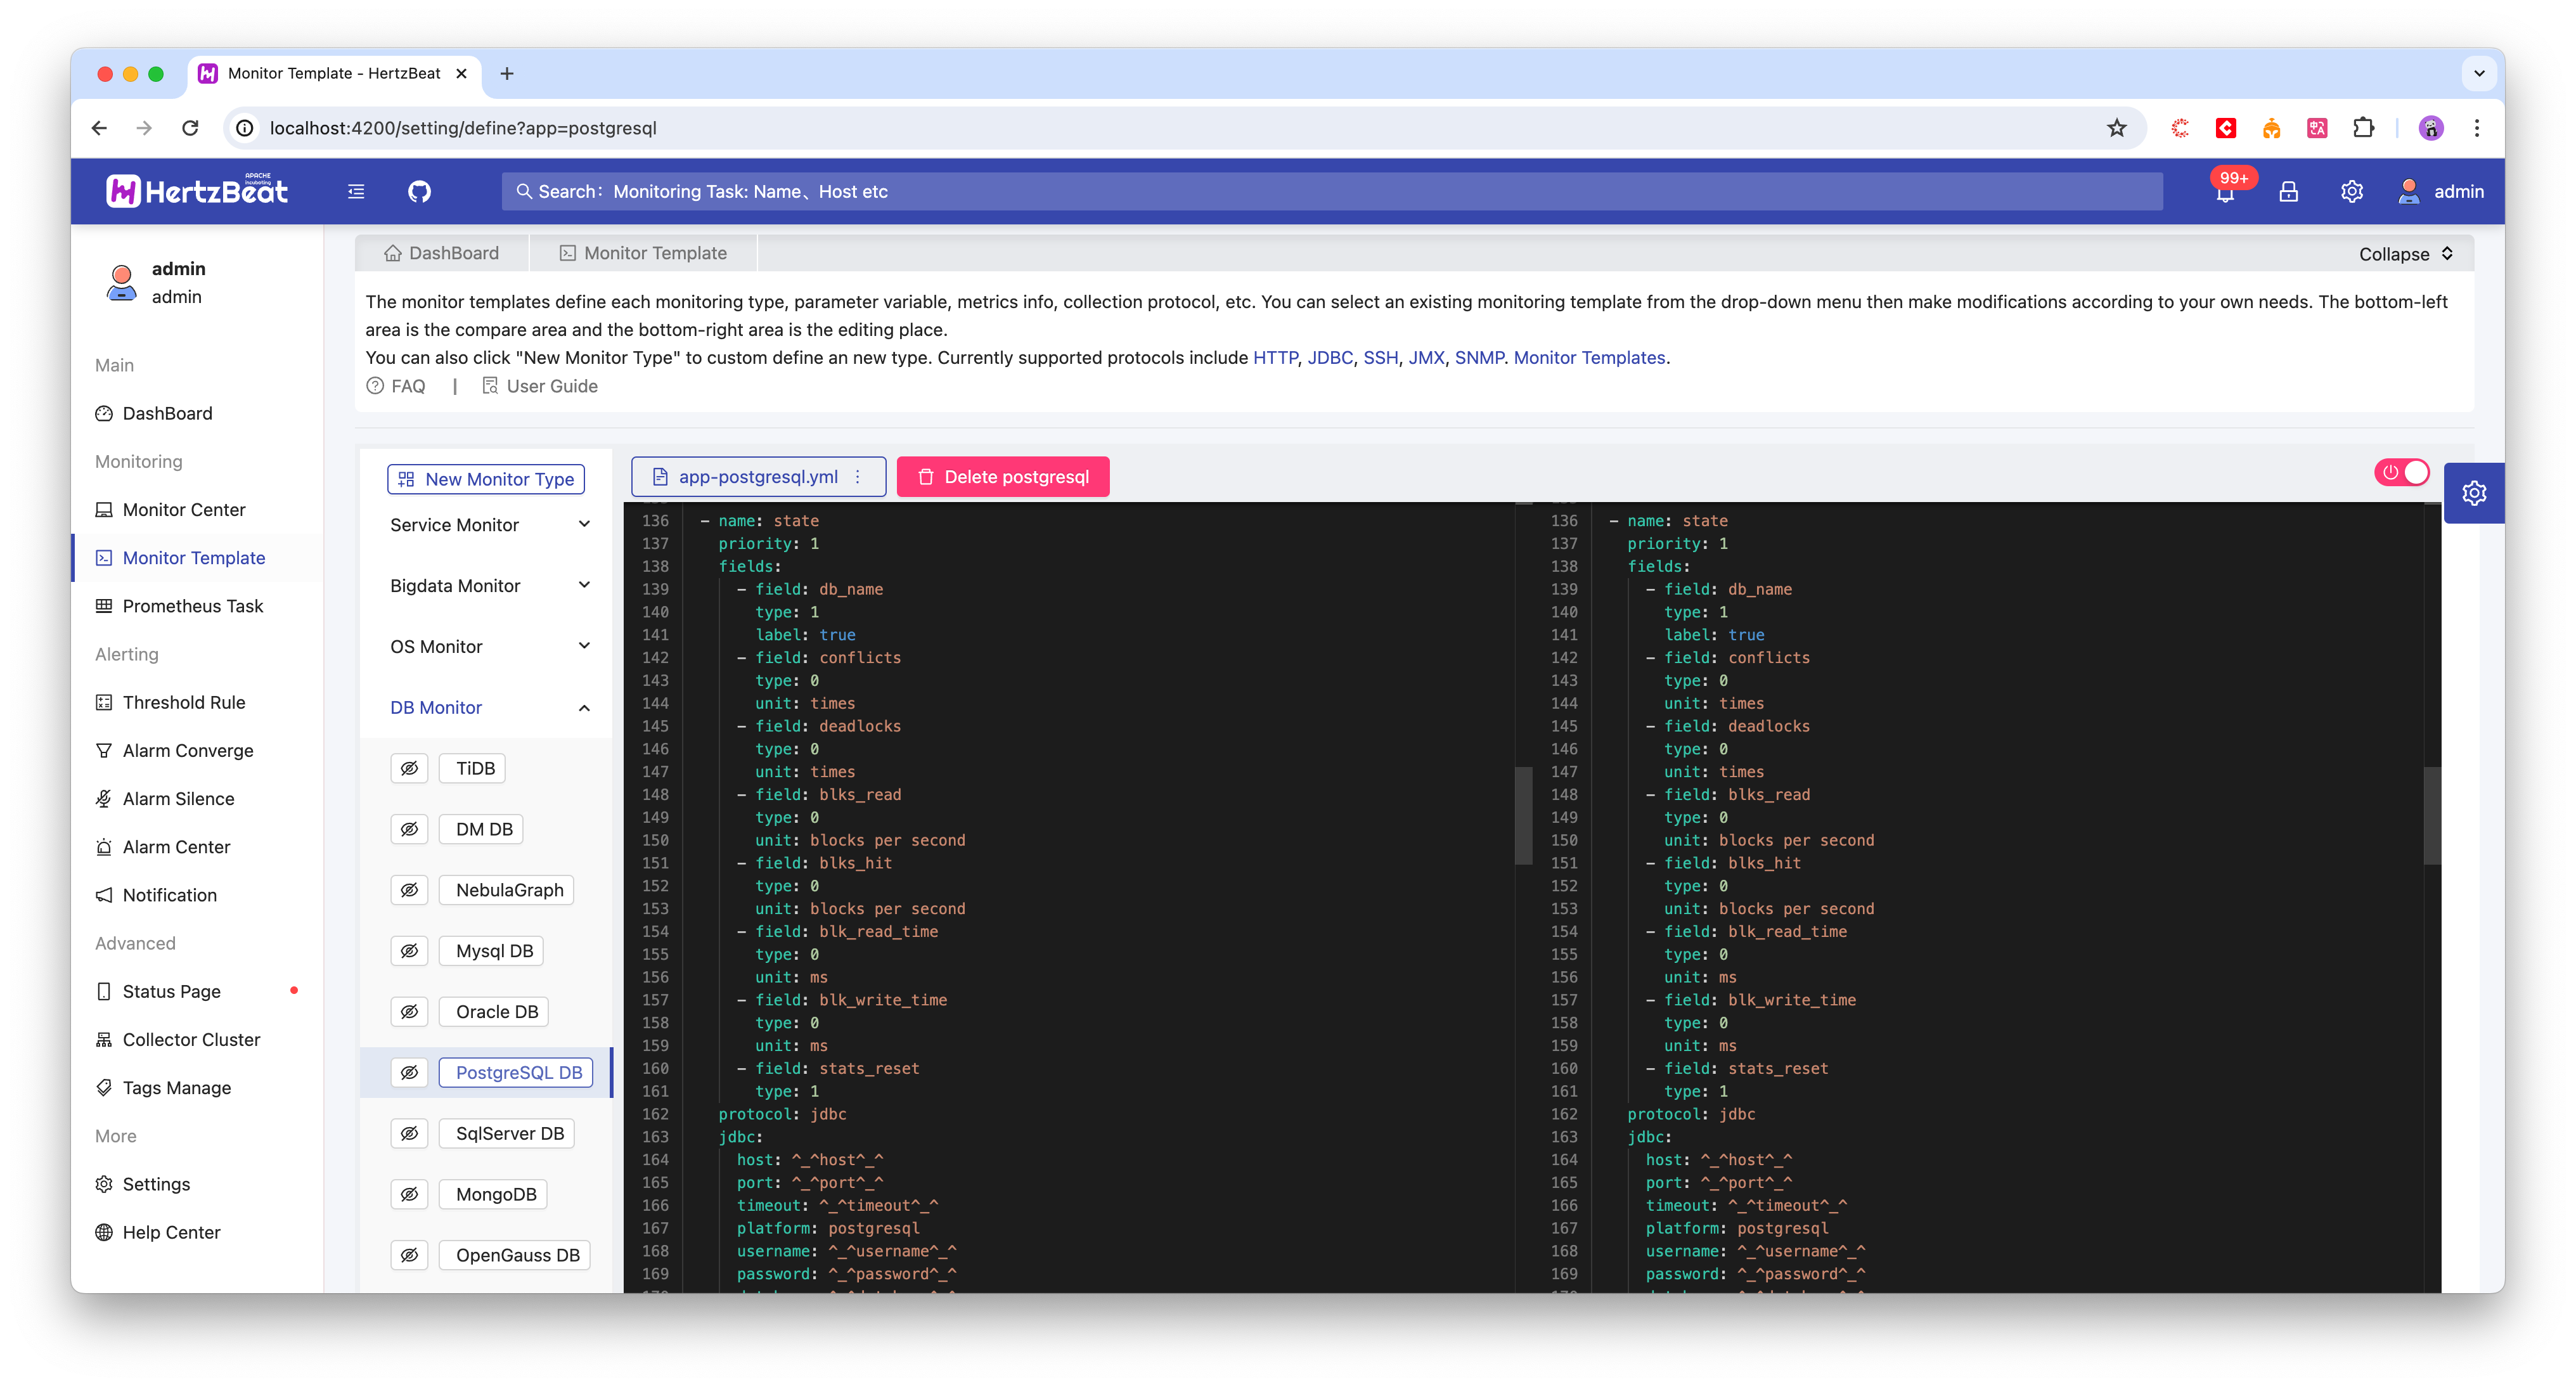
Built-in Monitoring Types
There are a lot of built-in monitoring templates for users to add directly on the page, one monitoring type corresponds to one YML monitoring template.
- Website, Port Telnet, Http Api, Ping Connect, Jvm, SiteMap, Ssl Certificate, SpringBoot2, FTP Server, SpringBoot3, Udp Port, Dns, Pop3, Ntp, Api Code, Smtp, Nginx
- Mysql, PostgreSQL, MariaDB, Redis, ElasticSearch, SqlServer, Oracle, MongoDB, DM, OpenGauss, ClickHouse, IoTDB, Redis Cluster, Redis Sentinel, Doris BE, Doris FE, Memcached, NebulaGraph
- Linux, Ubuntu, CentOS, Windows, EulerOS, Fedora CoreOS, OpenSUSE, Rocky Linux, Red Hat, FreeBSD, AlmaLinux, Debian Linux
- Tomcat, Nacos, Zookeeper, RabbitMQ, Flink, Kafka, ShenYu, DynamicTp, Jetty, ActiveMQ, Spring Gateway, EMQX MQTT, AirFlow, Hive, Spark, Hadoop
- Kubernetes, Docker
- CiscoSwitch, HpeSwitch, HuaweiSwitch, TpLinkSwitch, H3cSwitch
- And More Your Custom Template.
- Notified Support
DiscordSlackTelegramEmailDingtalkWeChatFeiShuWebhookSMSServerChan.
Powerful Customization
From the previous introduction of Monitoring Templates, it is clear that
HertzBeathas powerful customization features. Each monitor type is considered as a monitor template, no matter it is built-in or user-defined. You can easily add, modify and delete indicators by modifying the monitoring template. The templates contain a series of functions such as protocol configuration, environment variables, metrics conversion, metrics calculation, units conversion, metrics collection, etc., which help users to collect the metrics they want.
No Agent Required
For users who have used various systems, the most troublesome thing is the installation, deployment, debugging and upgrading of various
agents. You need to install oneagentper host, and several correspondingagentsto monitor different application middleware, and the number of monitoring can easily reach thousands, so writing a batch script may ease the burden. The problem of whether the version ofagentis compatible with the main application, debugging the communication betweenagentand the main application, upgrading theagentsynchronization and so on and so forth, are all big headaches.
The principle of HertzBeat is to use different protocols to connect directly to the end system, and use the PULL form to pull the collected data, without the need for the user to deploy and install Agent | Exporter on the host of the end, etc. For example, monitoring the linux operating system.
- For example, if you want to monitor
linux OS, you can just input the IP port account password or key onHertzBeatside. - For example, to monitor
linux OS, just enter your ip/port account password or key inHertzBeat.
Password and other sensitive information is encrypted on all links.
High Performance Clustering
When the number of monitors rises exponentially, the collection performance drops or the environment is unstable and prone to single point of failure of the collectors, then our collector clusters come into play.
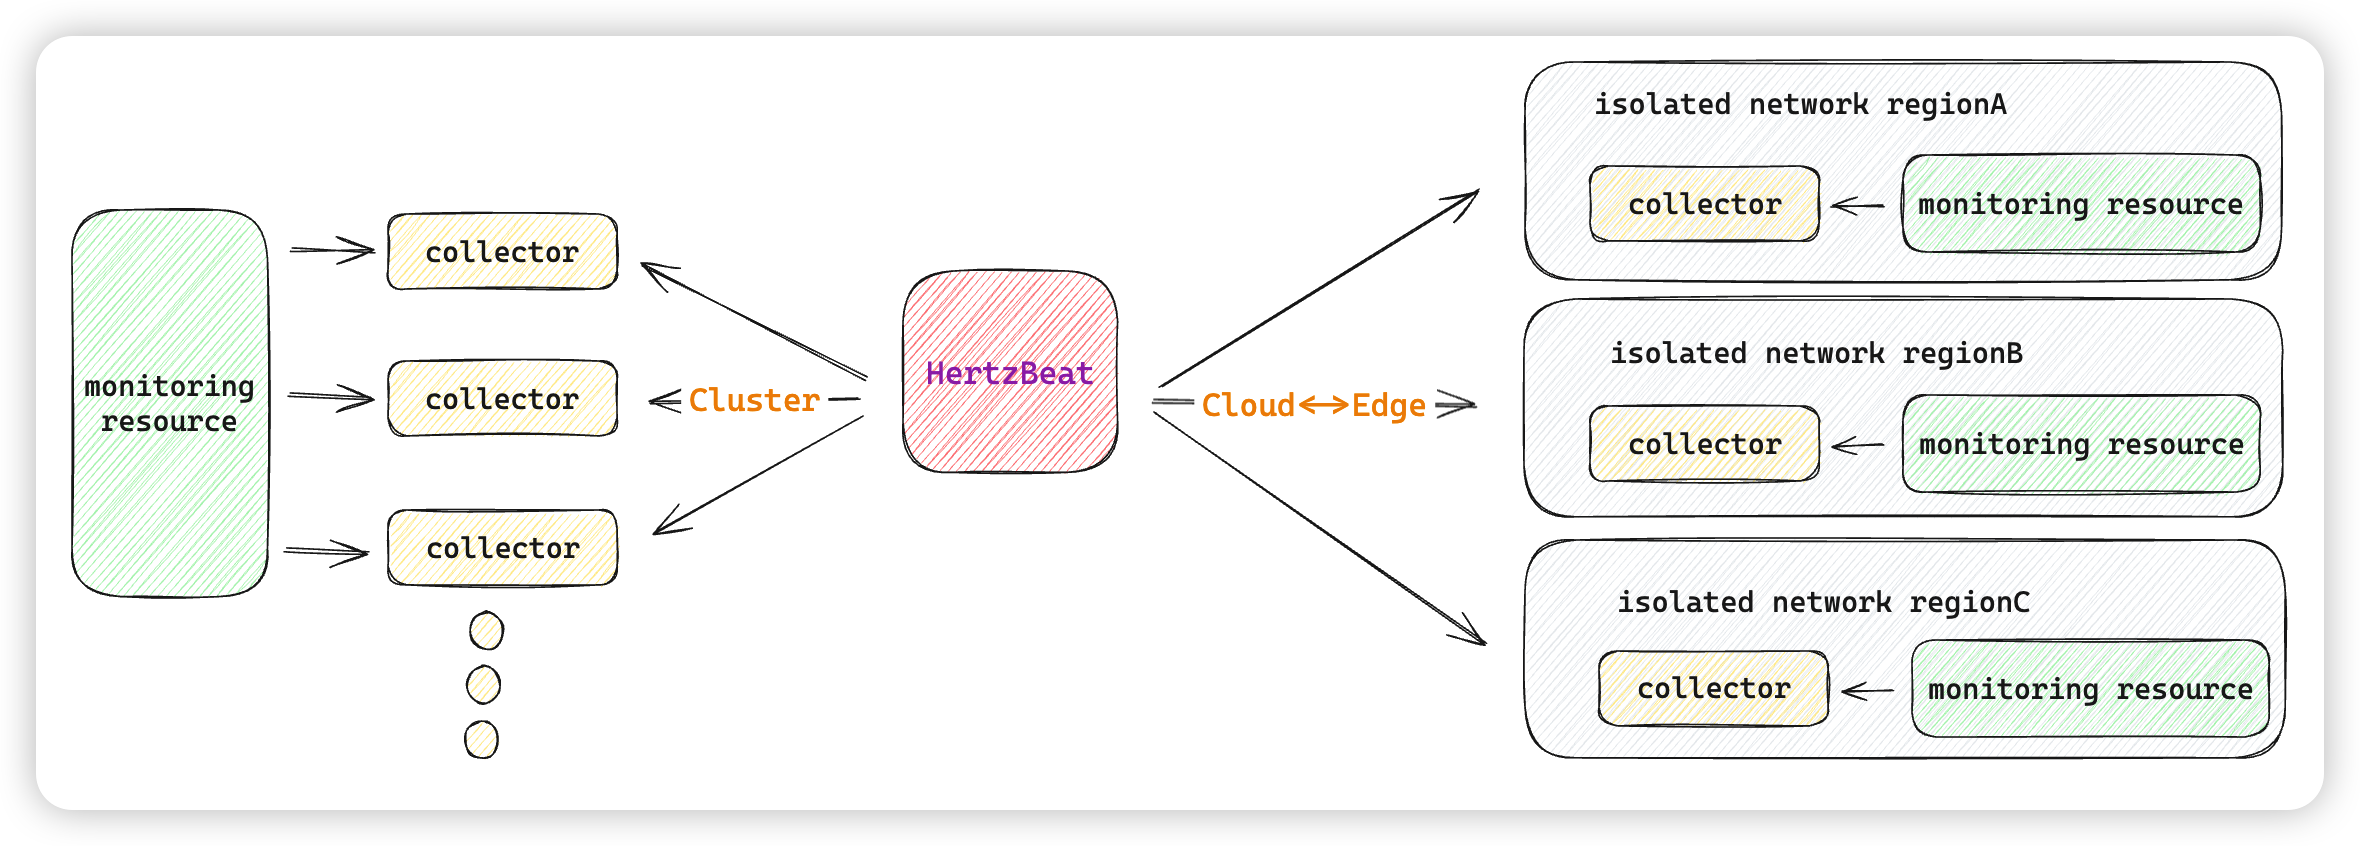
- HertzBeat supports the deployment of collector clusters and the horizontal expansion of multiple collector clusters to exponentially increase the number of monitorable tasks and collection performance.
- Monitoring tasks are self-scheduled in the collector cluster, single collector hangs without sensing the failure to migrate the collection tasks, and the newly added collector nodes are automatically scheduled to share the collection pressure.
- It is very easy to switch between stand-alone mode and cluster mode without additional component deployment.
Cloud Edge Collaboration
Two locations, three centers, multi-cloud environments, multi-isolated networks, you may have heard of these scenarios. When there is a need for a unified monitoring system to monitor the IT resources of different isolated networks, this is where our Cloud Edge Collaboration comes in.
In an isolated network where multiple networks are not connected, we need to deploy a monitoring system in each network in the previous solution, which leads to data non-interoperability and inconvenient management, deployment and maintenance.
HertzBeat provides the ability of cloud edge collaboration, can be deployed in multiple isolated networks edge collector, collector in the isolated network within the monitoring task collection, collection of data reported by the main service unified scheduling management display.
Easy to Use
- Set Monitoring+Alarm+Notification All in one, no need to deploy multiple component services separately.
- Full UI interface operation, no matter adding new monitor, modifying monitor template, or alarm threshold notification, all can be done in WEB interface, no need to modify files or scripts or reboot.
- No Agent is needed, we only need to fill in the required IP, port, account, password and other parameters in the WEB interface.
- Customization friendly, only need a monitoring template YML, automatically generate monitoring management page, data chart page, threshold configuration for corresponding monitoring types.
- Threshold alarm notification friendly, based on the expression threshold configuration, a variety of alarm notification channels, support alarm silence, time label alarm level filtering and so on.
Completely Open Source
- An open source collaboration product using the
Apache2protocol, maintained by a free and open source community. - No monitoring number
License, monitoring type and other pseudo-open source restrictions . - Built on
Java+SpringBoot+TypeScript+Angularmainstream technology stack , convenient secondary development . - Dev based on HertzBeat need retain copyright.
HertzBeat has been included in the CNCF Observability And Analysis - Observability Landscape

HertzBeat's powerful customization, multi-type support, high performance, easy expansion, and low coupling, aims to help users quickly build their own monitoring system.
Quickly Start
Just run a single command in a Docker environment: docker run -d -p 1157:1157 -p 1158:1158 --name hertzbeat apache/hertzbeat
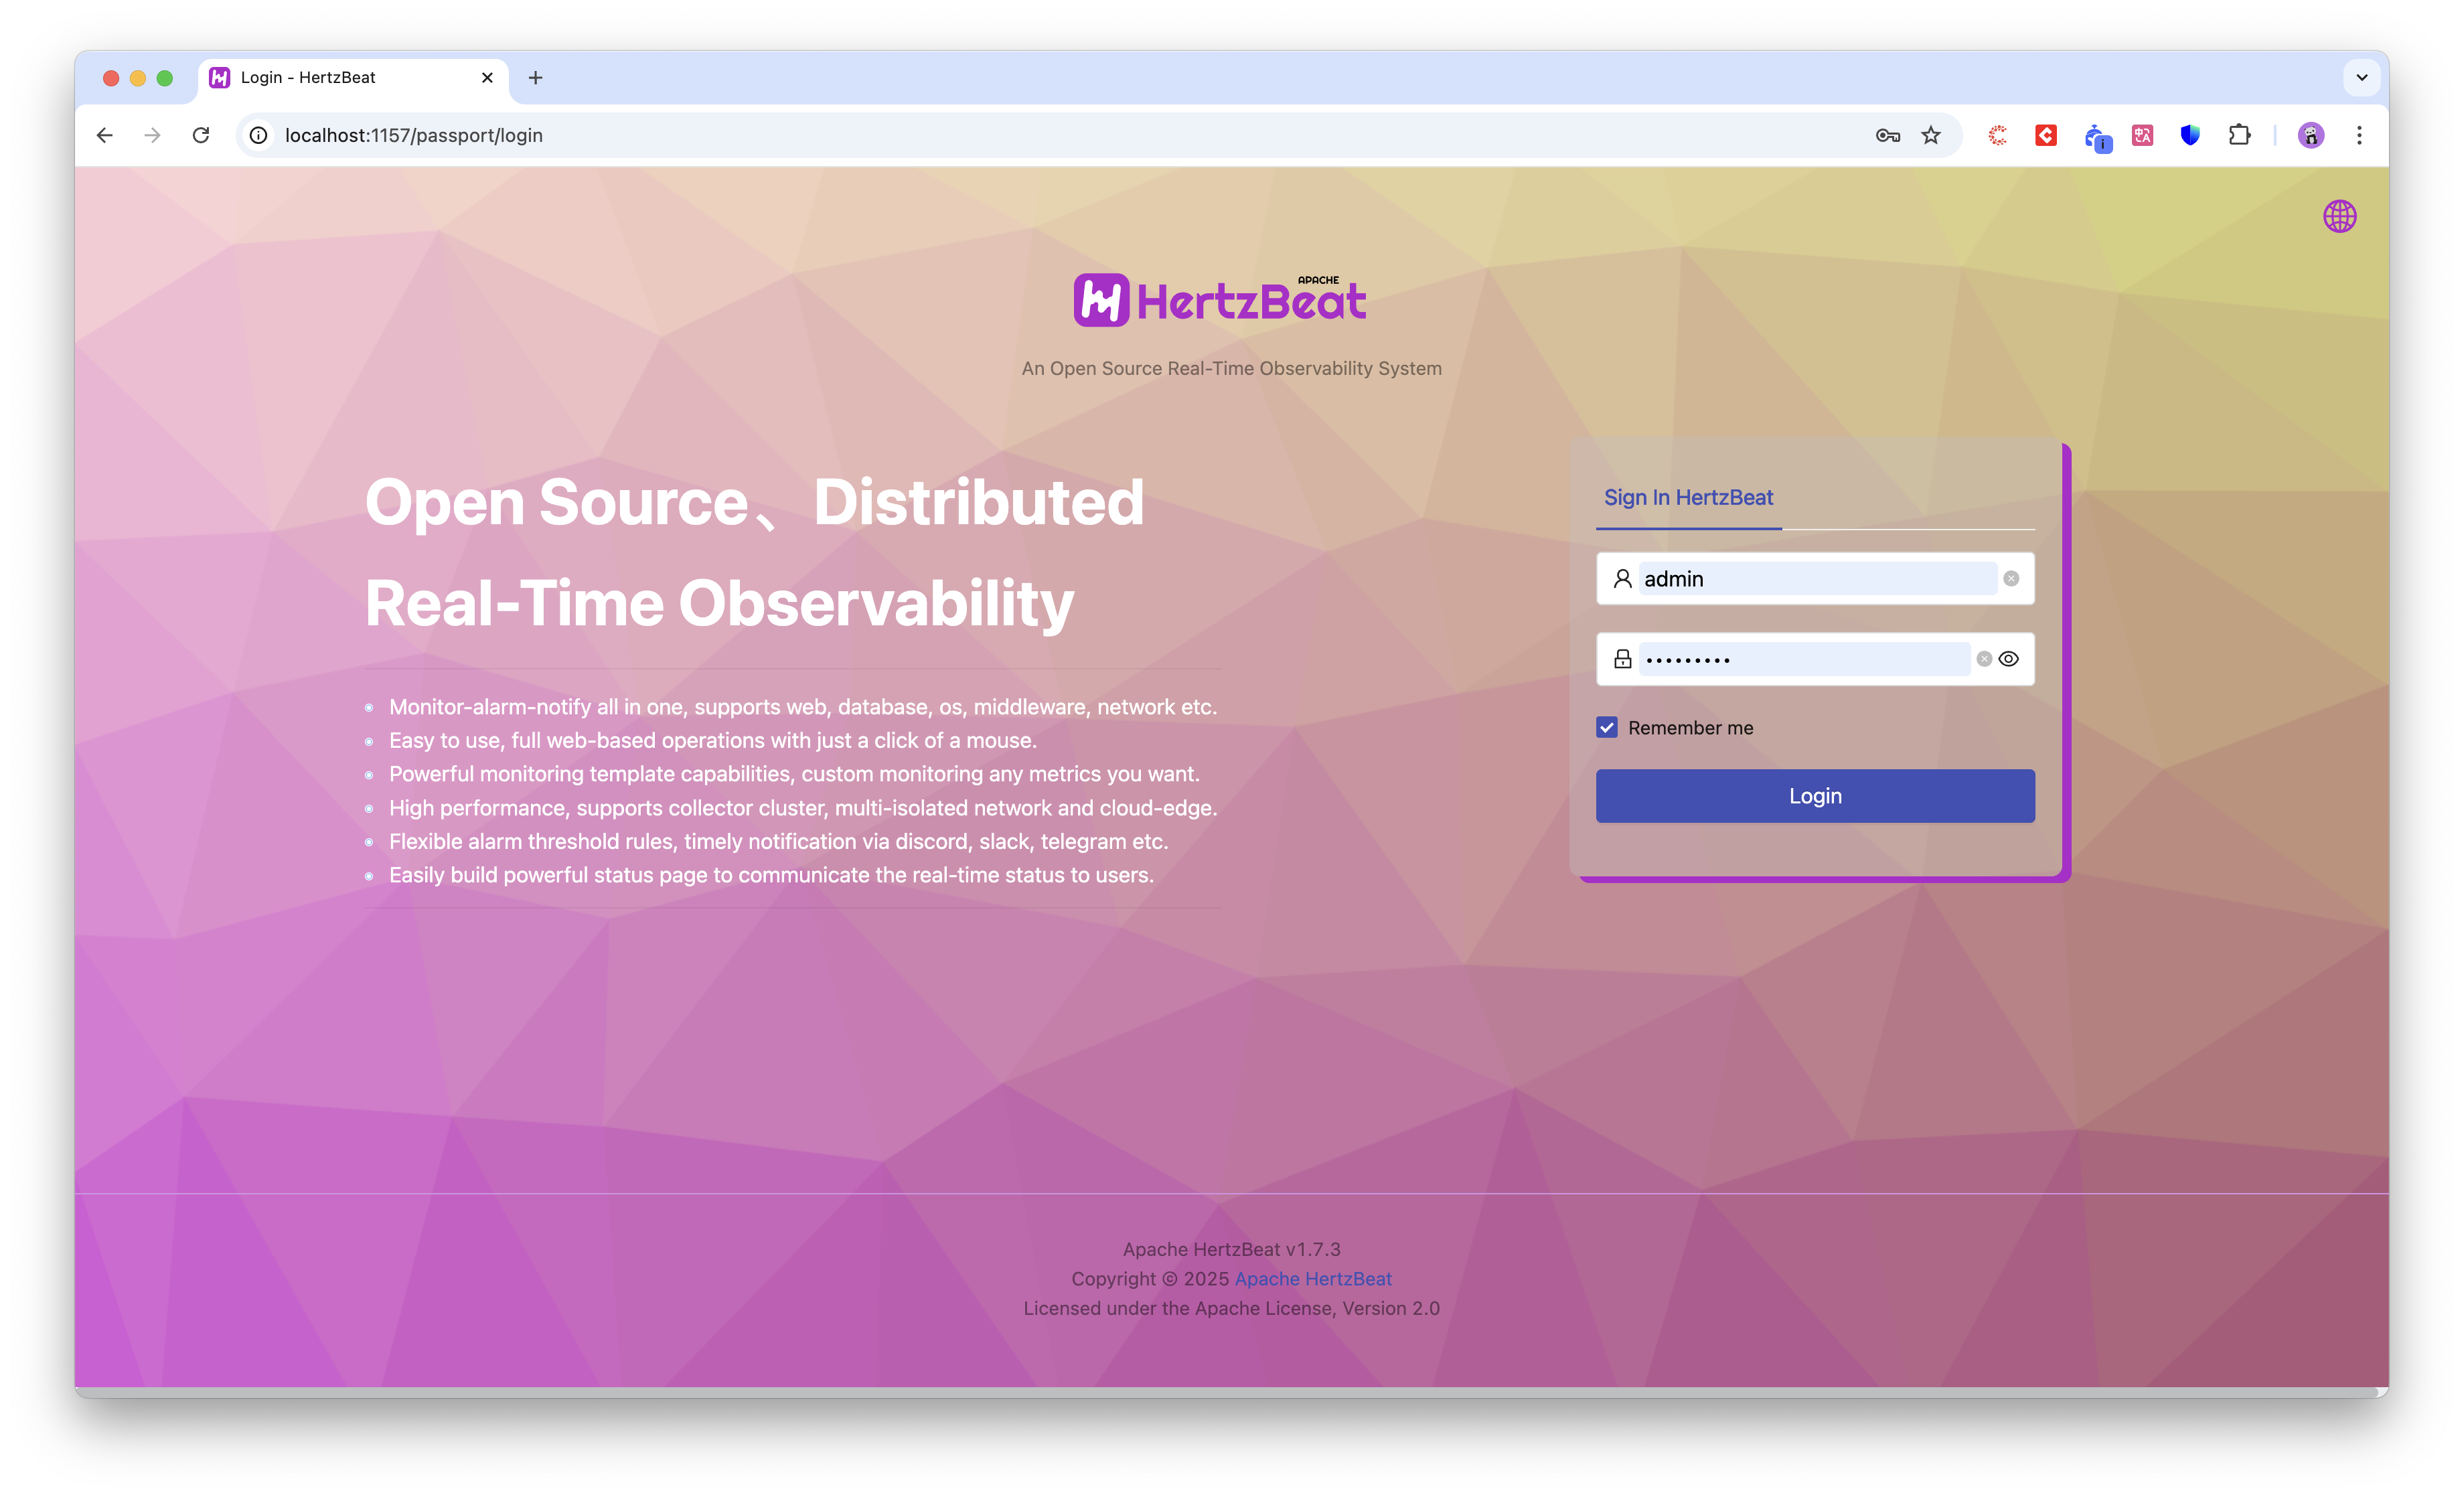
Browser access http://localhost:1157 default account password admin/hertzbeat
Landing Page
- HertzBeat's user management is unified by the configuration file
sureness.yml, which allows users to add, delete, and modify user information, user role permissions, and so on. Default password admin/hertzbeat
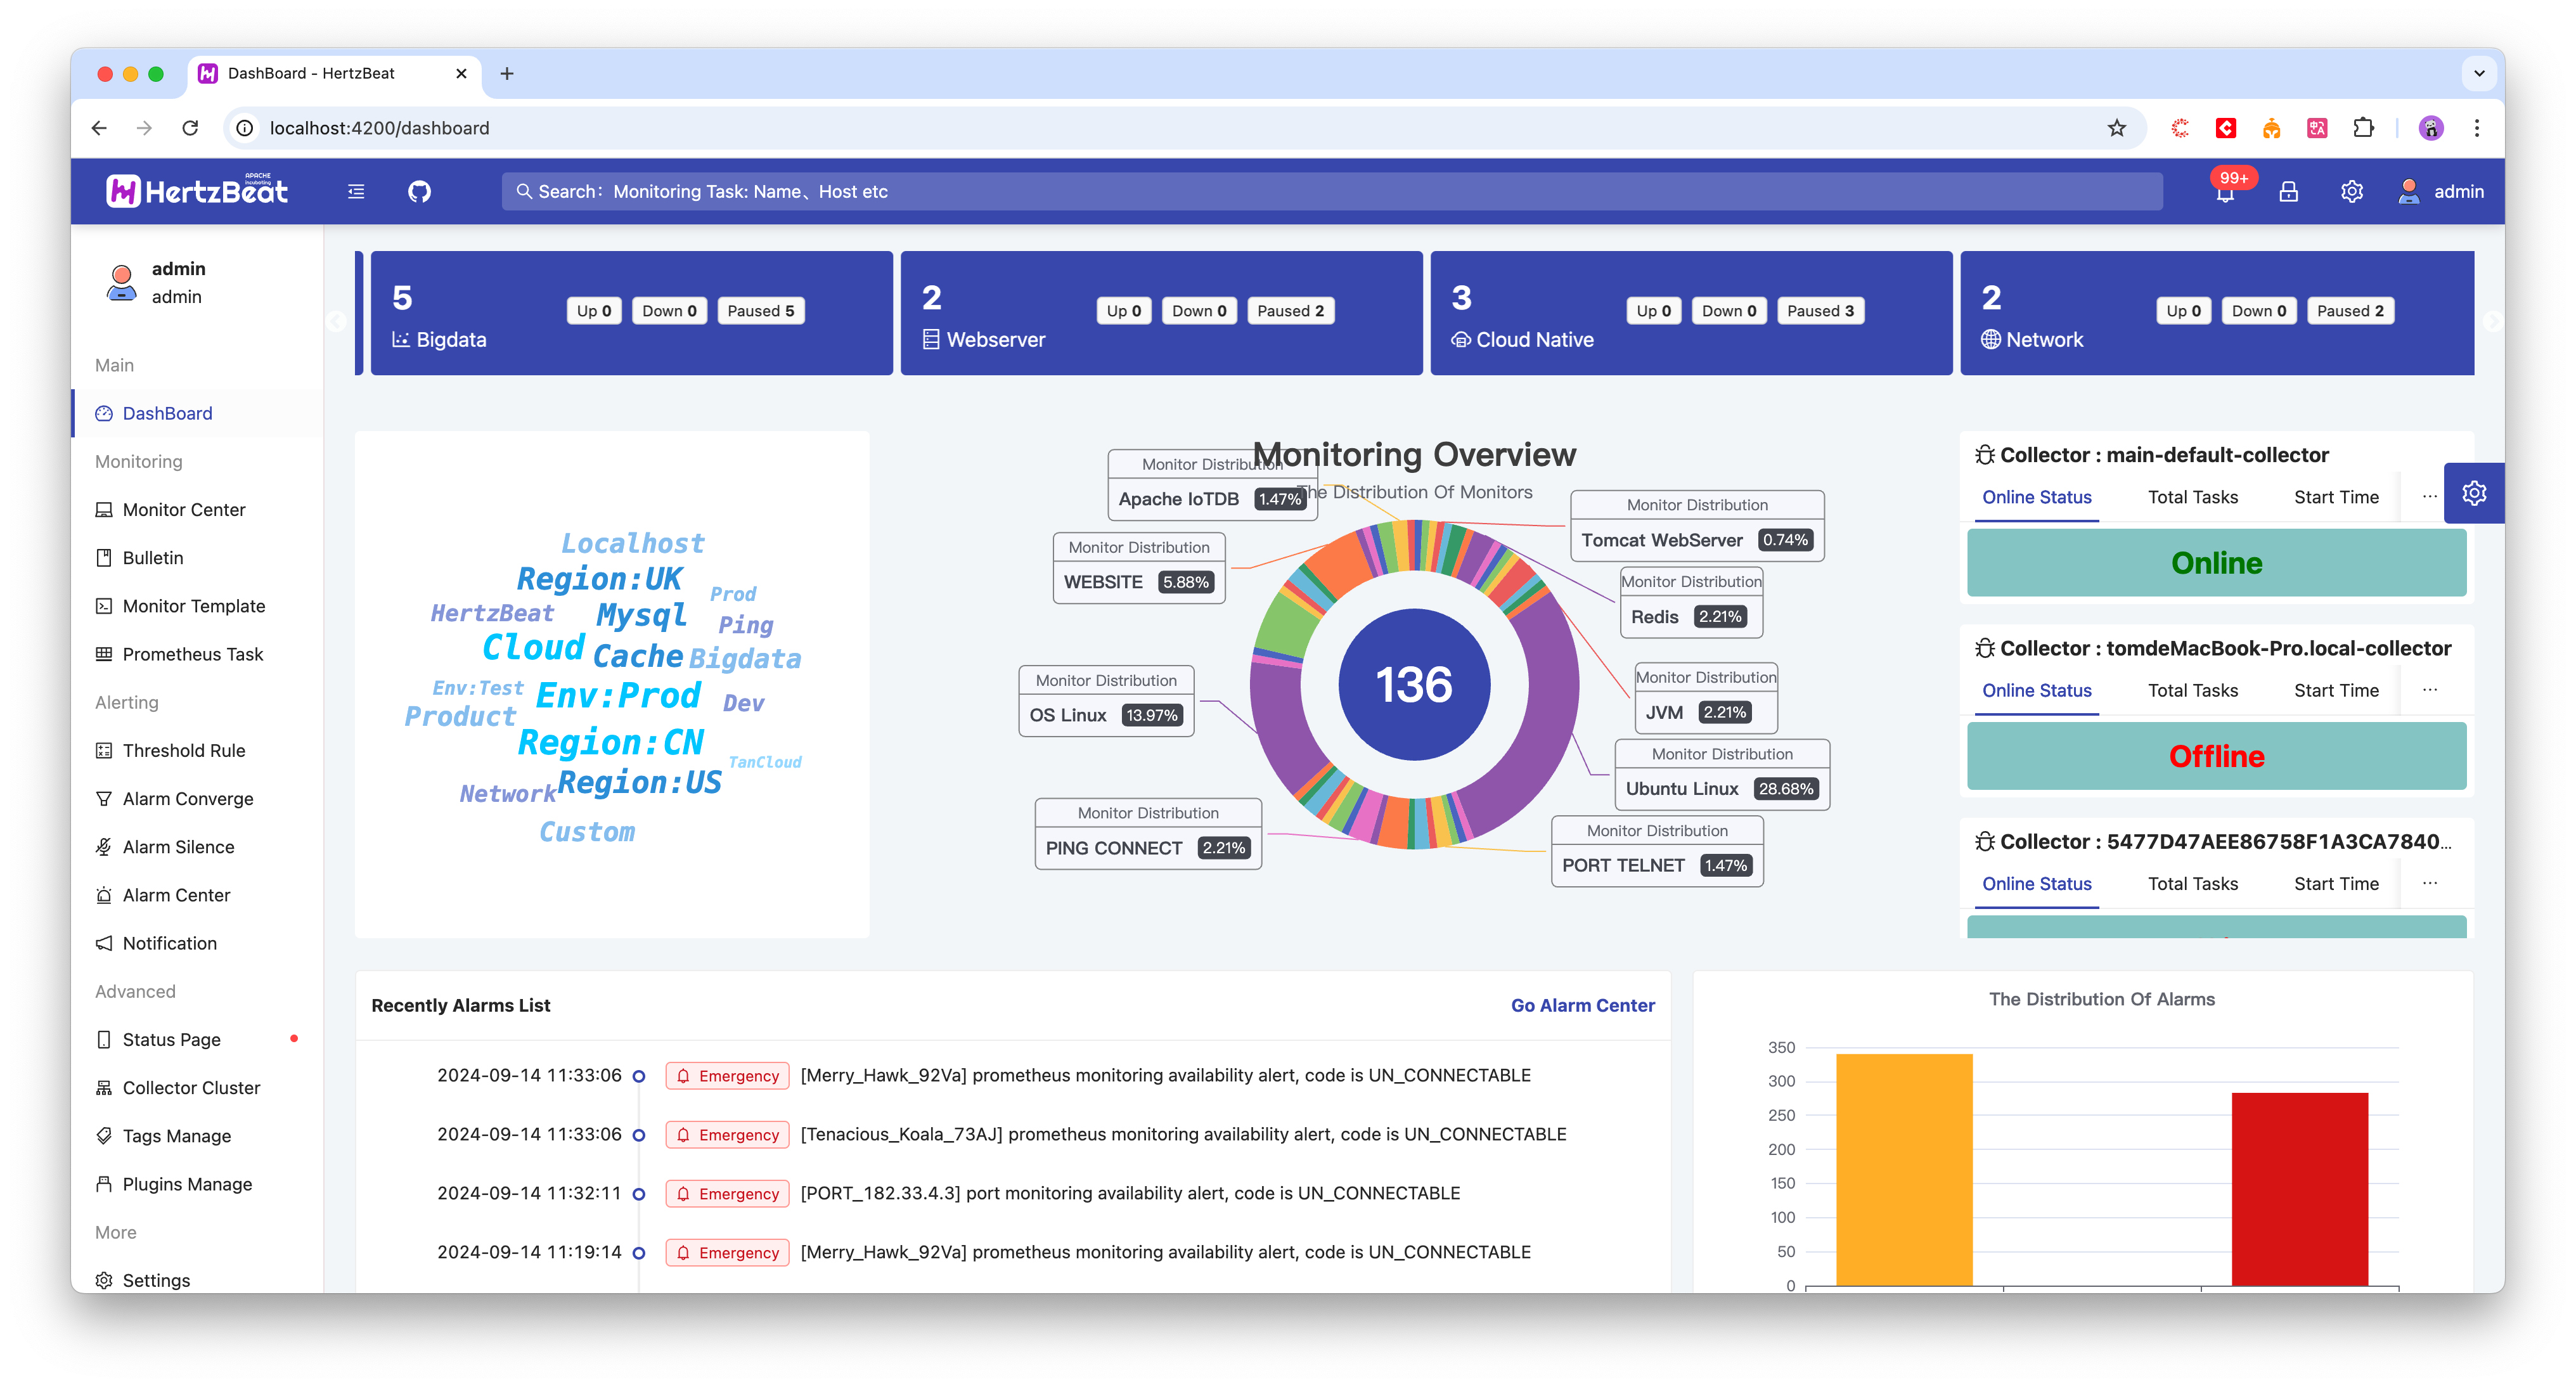
Overview Page
- The global overview page shows the distribution of current monitoring categories, users can visualize the current monitoring types and quantities and click to jump to the corresponding monitoring types for maintenance and management.
- Show the status of currently registered collector clusters, including collector on-line status, monitoring tasks, startup time, IP address, name and so on.
- Show the list of recent alarm messages, alarm level distribution and alarm processing rate.
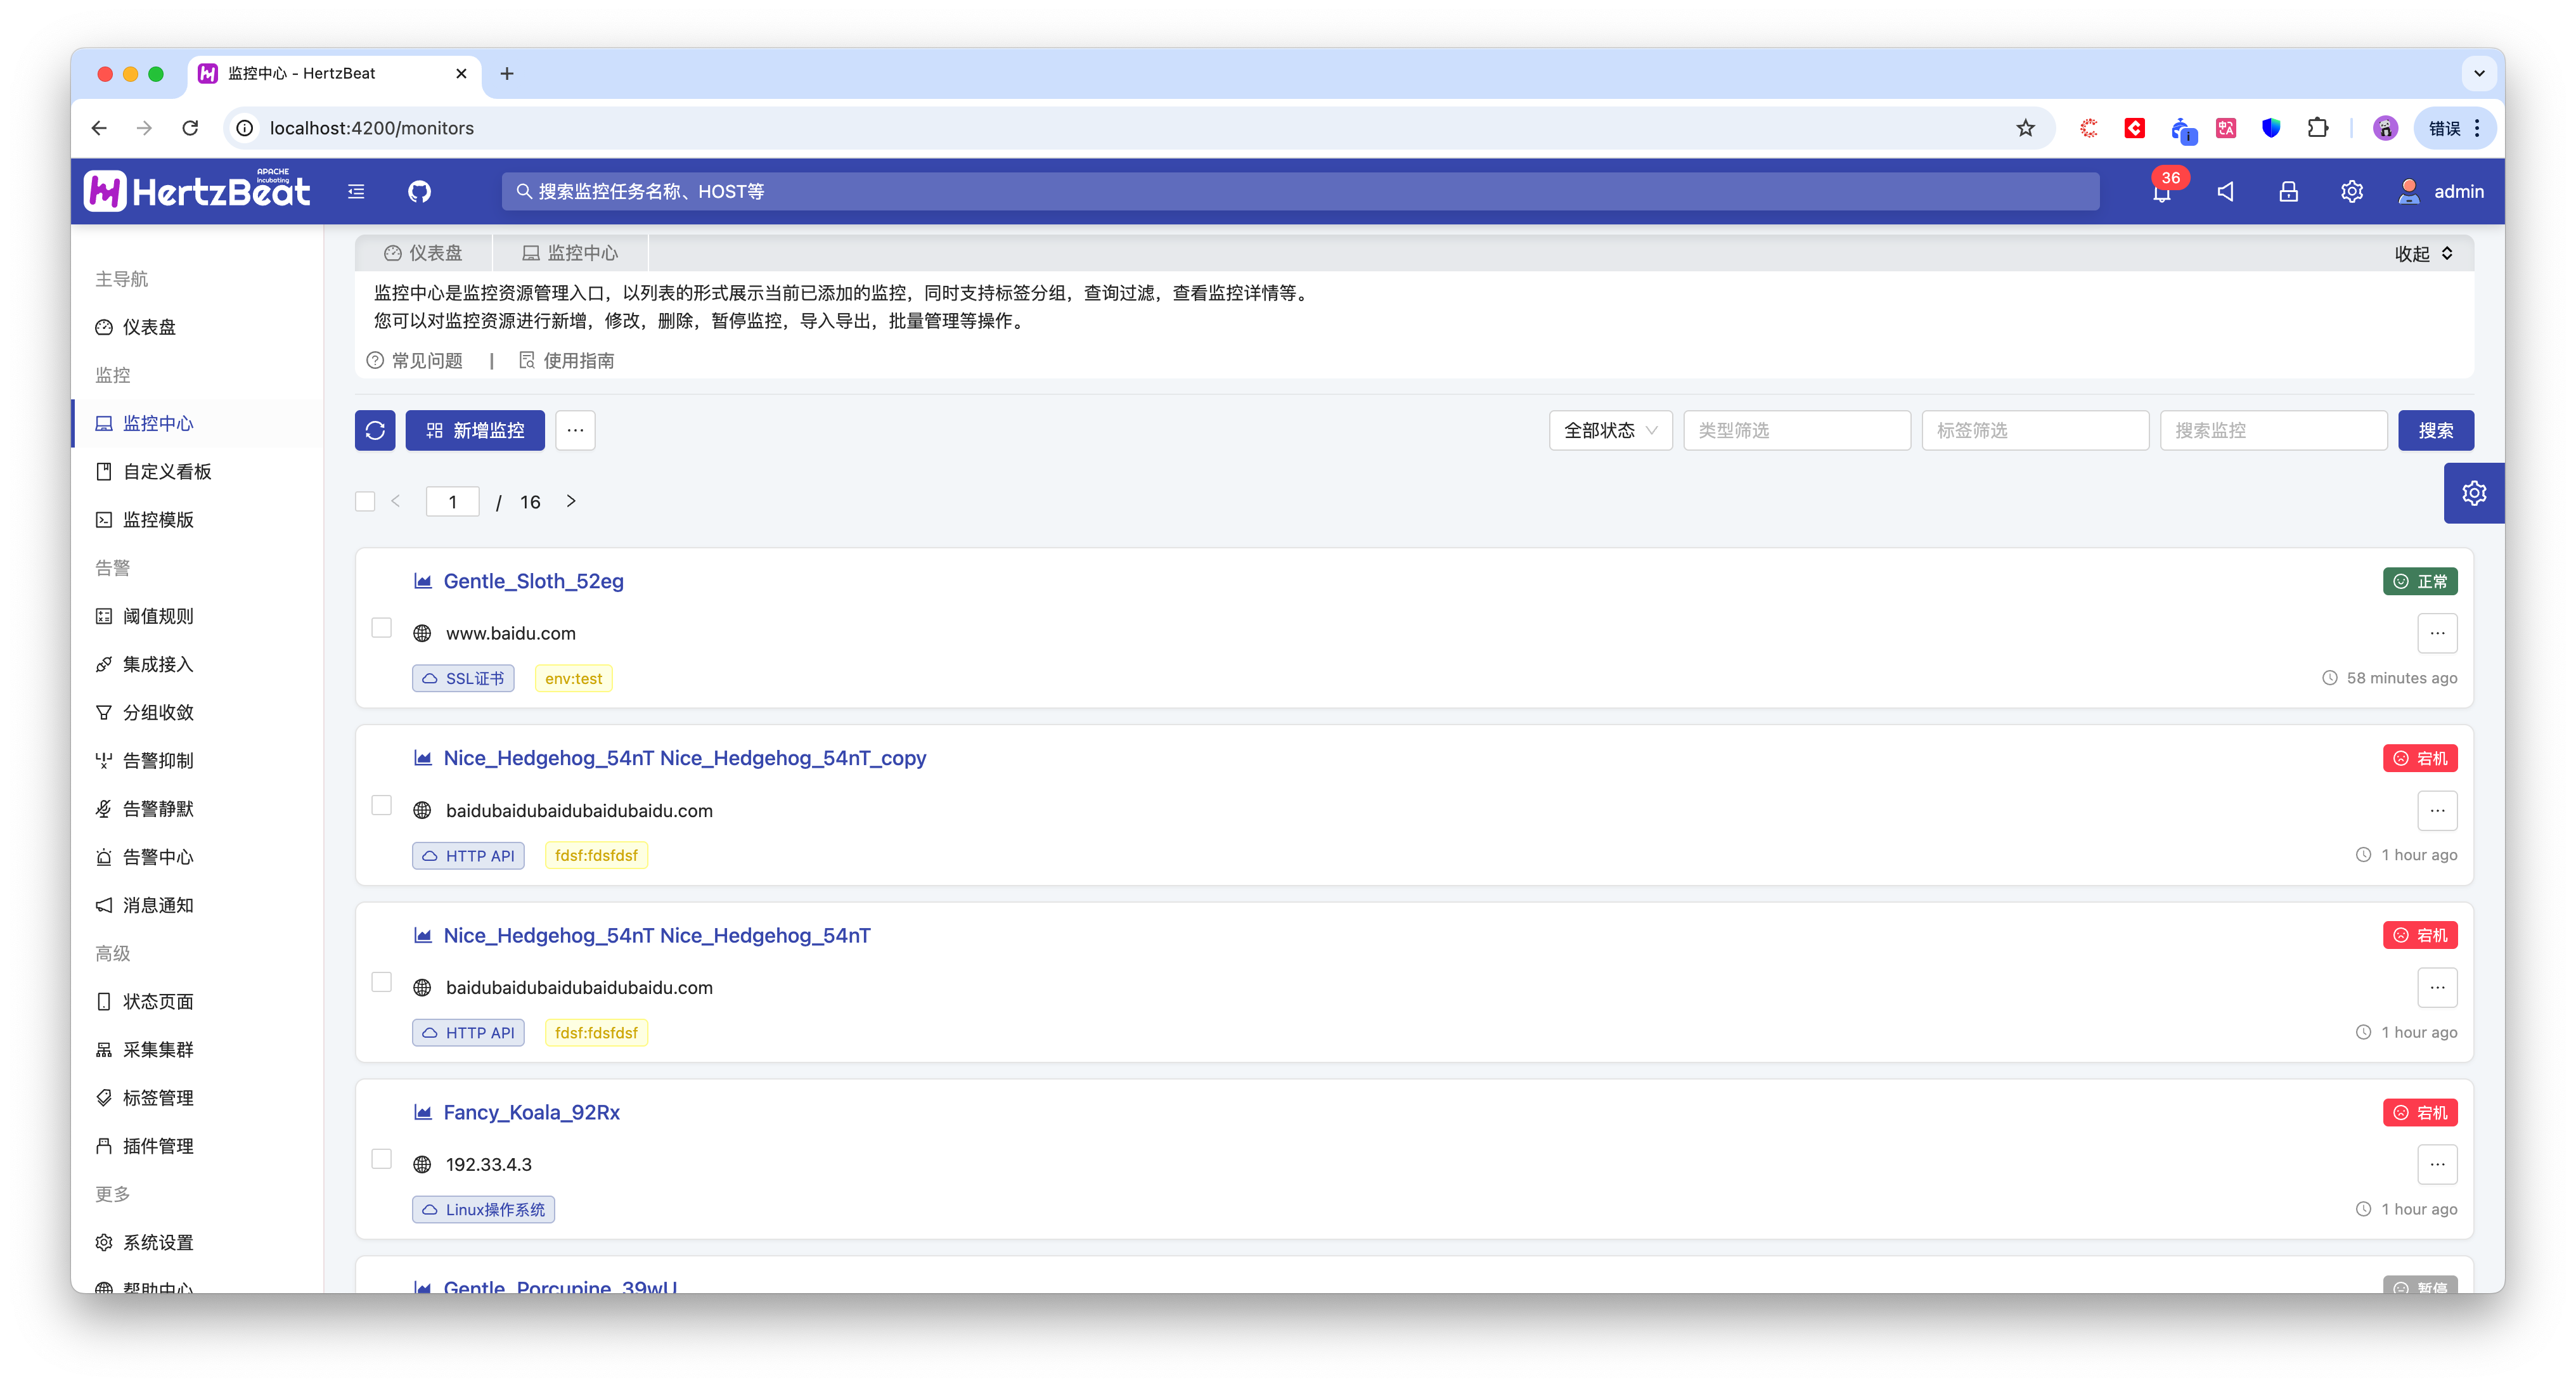
Monitoring Center
- The monitoring portal supports the management of monitoring of application services, database, operating system, middleware, network, customization, etc. It displays the currently added monitors in the form of a list.
- It displays the currently added monitors in the form of a list and supports adding, modifying, deleting, canceling, importing, exporting and batch management of monitors.
- Support tag grouping, query filtering, view monitoring details portal.
Built-in support for monitoring types include:
- Website, Port Telnet, Http Api, Ping Connect, Jvm, SiteMap, Ssl Certificate, SpringBoot2, FTP Server, SpringBoot3, Udp Port, Dns, Pop3, Ntp, Api Code, Smtp, Nginx
- Mysql, PostgreSQL, MariaDB, Redis, ElasticSearch, SqlServer, Oracle, MongoDB, DM, OpenGauss, ClickHouse, IoTDB, Redis Cluster, Redis Sentinel, Doris BE, Doris FE, Memcached, NebulaGraph
- Linux, Ubuntu, CentOS, Windows, EulerOS, Fedora CoreOS, OpenSUSE, Rocky Linux, Red Hat, FreeBSD, AlmaLinux, Debian Linux
- Tomcat, Nacos, Zookeeper, RabbitMQ, Flink, Kafka, ShenYu, DynamicTp, Jetty, ActiveMQ, Spring Gateway, EMQX MQTT, AirFlow, Hive, Spark, Hadoop
- Kubernetes, Docker
- CiscoSwitch, HpeSwitch, HuaweiSwitch, TpLinkSwitch, H3cSwitch
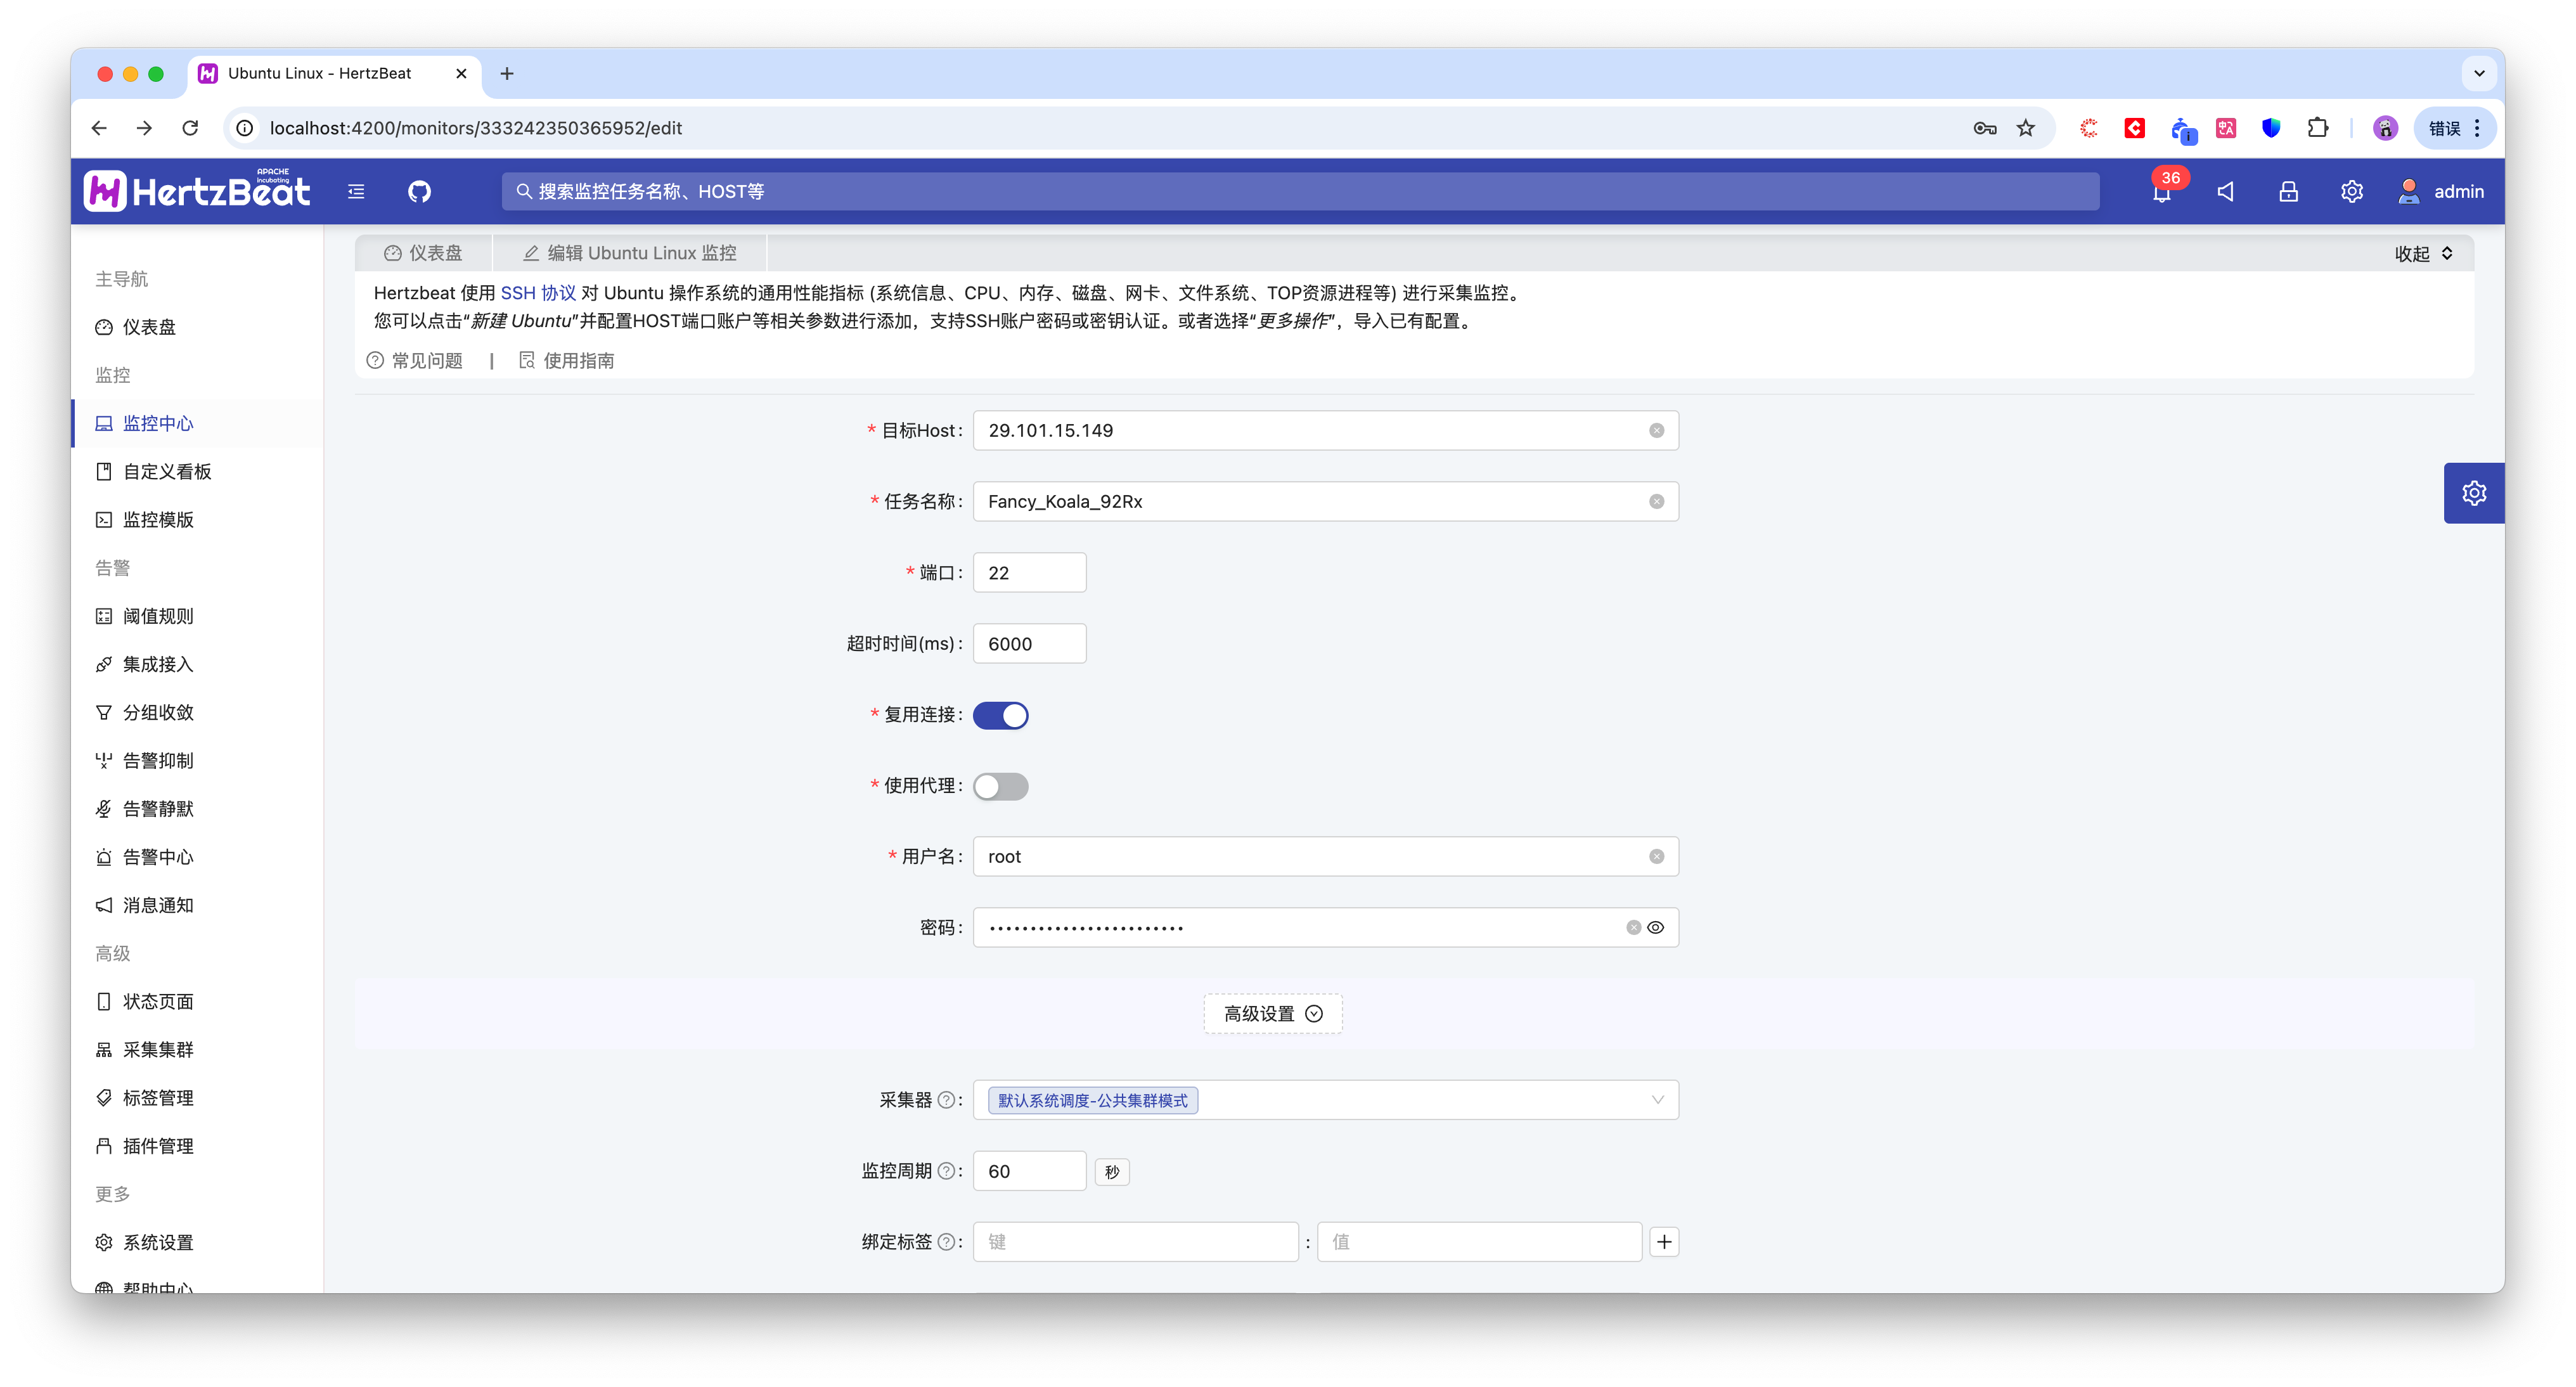
Add and Modify Surveillance
- You can add or modify monitoring instances of a specific monitoring type, configure the IP, port and other parameters of the monitoring on the other end, set the collection period, collection task scheduling method, support detecting availability in advance, etc. The monitoring instances on the page are defined by the corresponding monitoring templates.
- The monitoring parameters configured on the page are defined by the monitoring template of the corresponding monitoring type, and users can modify the configuration parameters on the page by modifying the monitoring template.
- Support associated tags to manage monitoring grouping, alarm matching, and so on.
Monitor Details
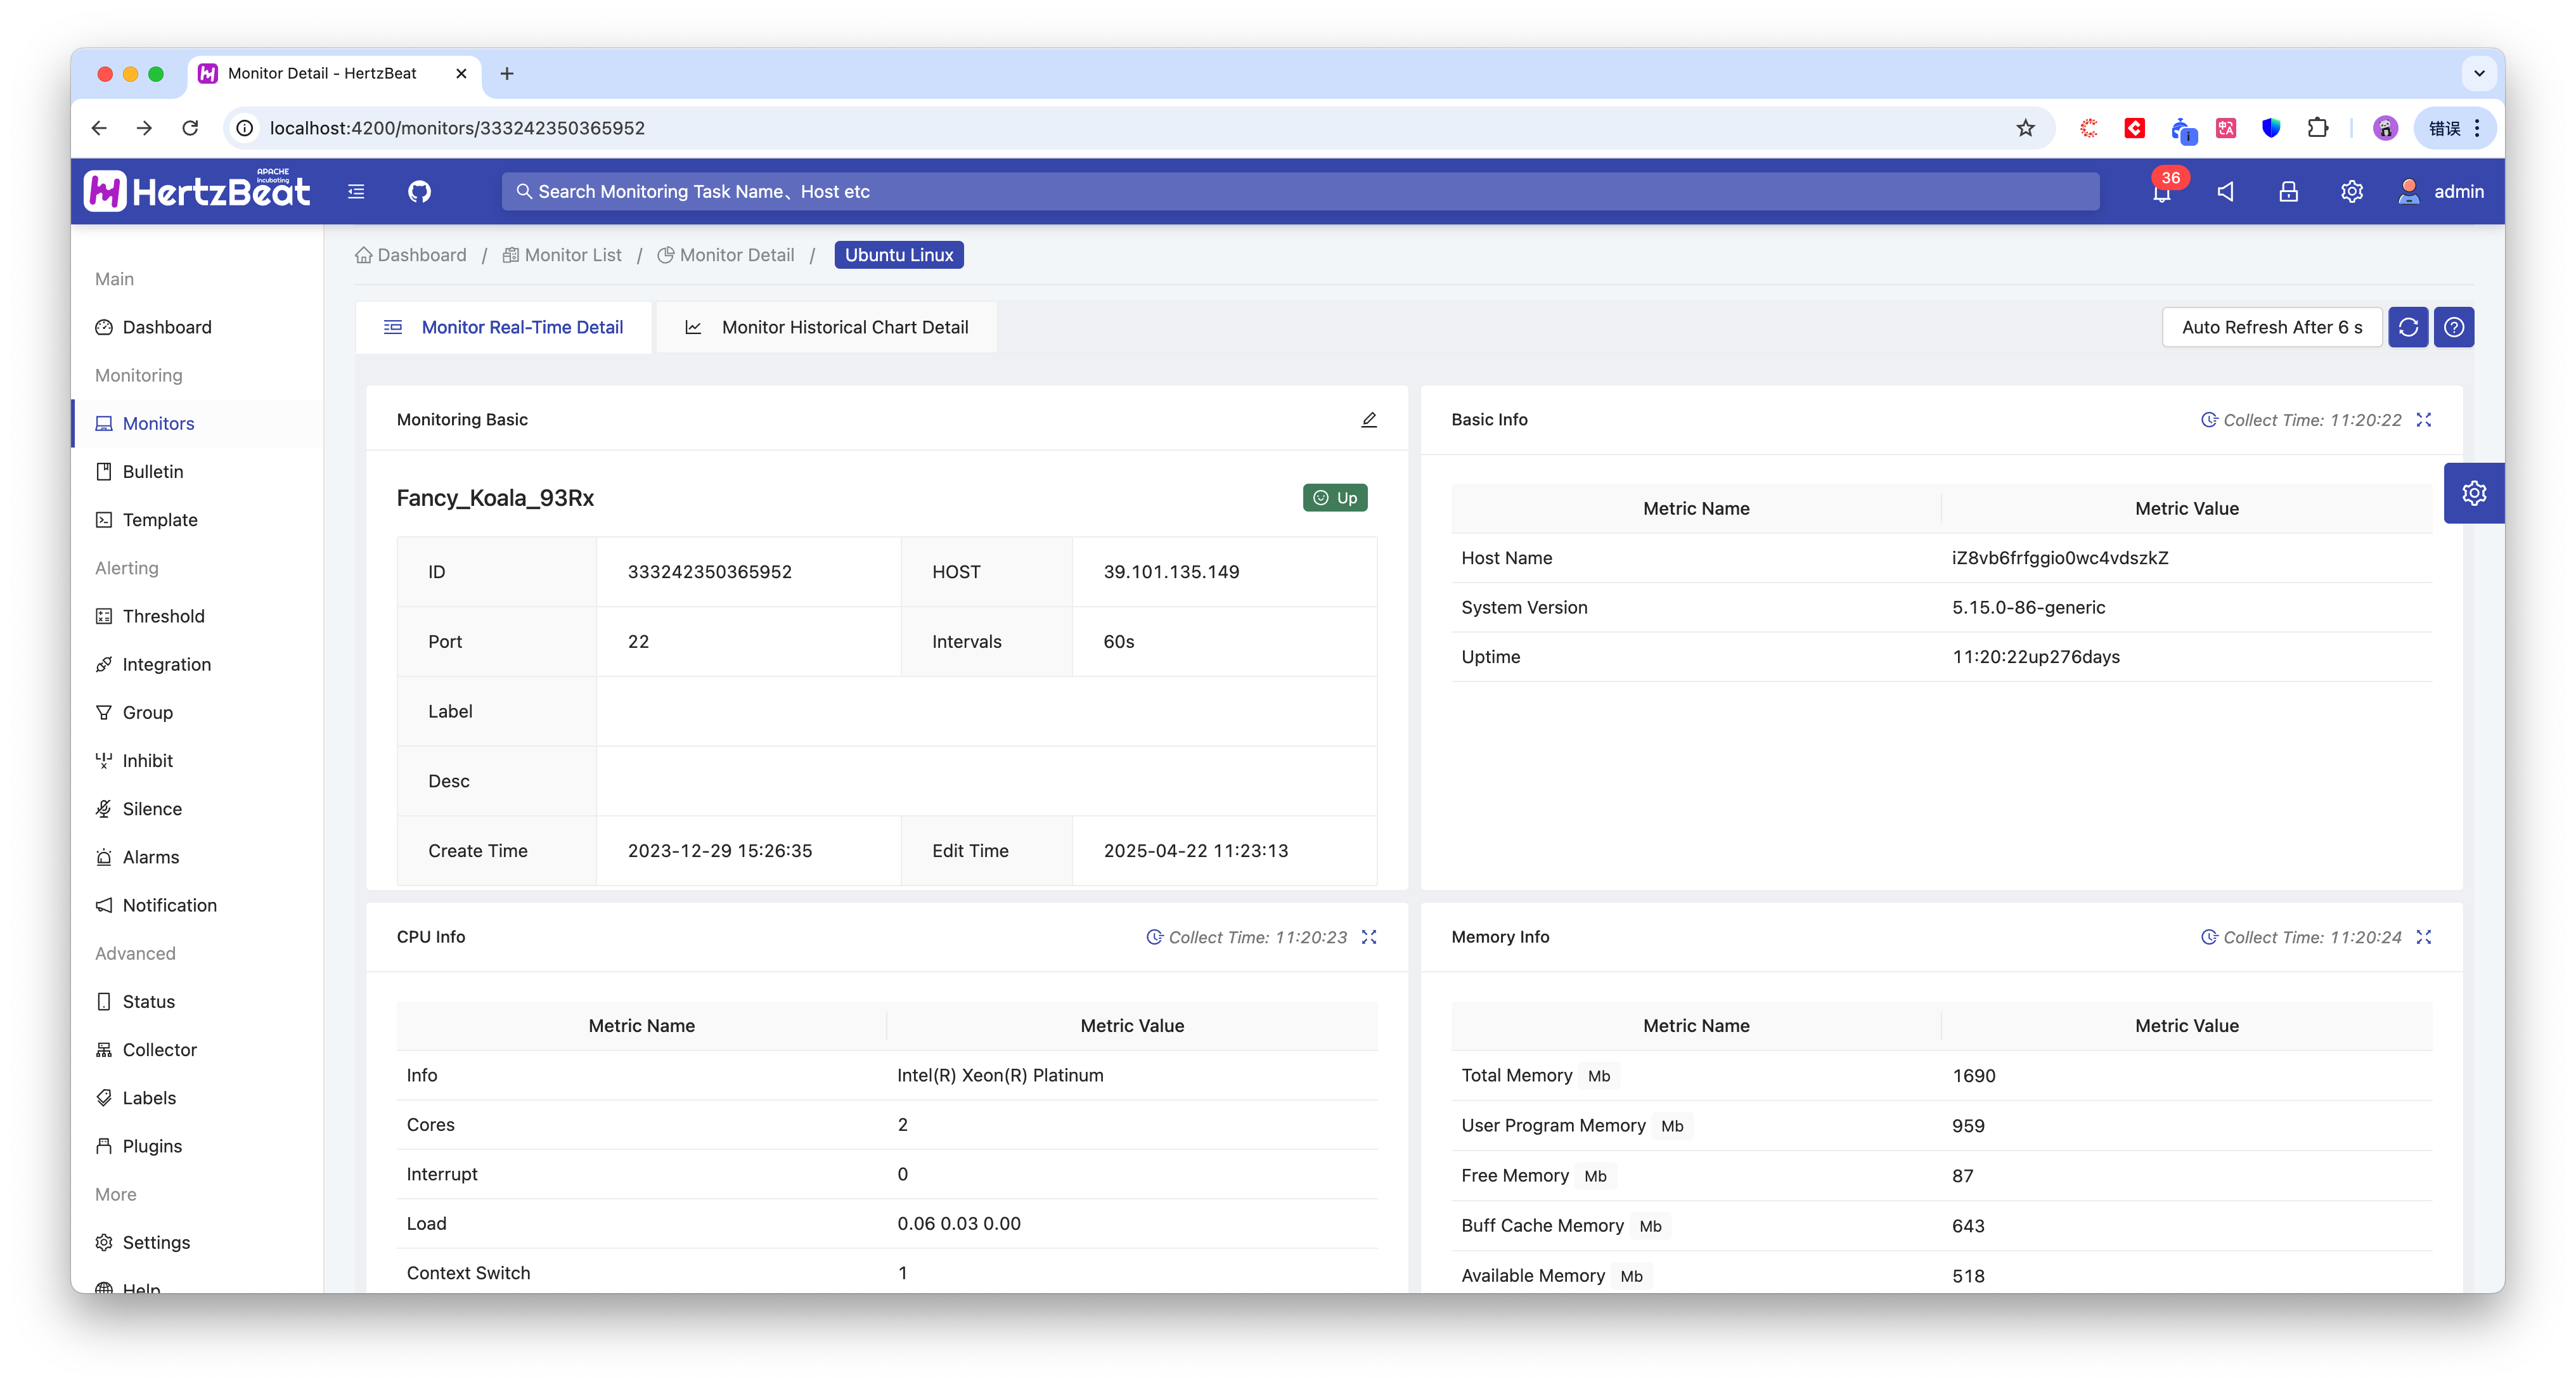
- The monitoring data detail page shows the basic parameter information of the current monitoring, and the monitoring indicator data information.
- Monitor Real-time Data Report displays the real-time values of all the currently monitored indicators in the form of a list of small cards, and users can configure alarm threshold rules based on the real-time values for reference.
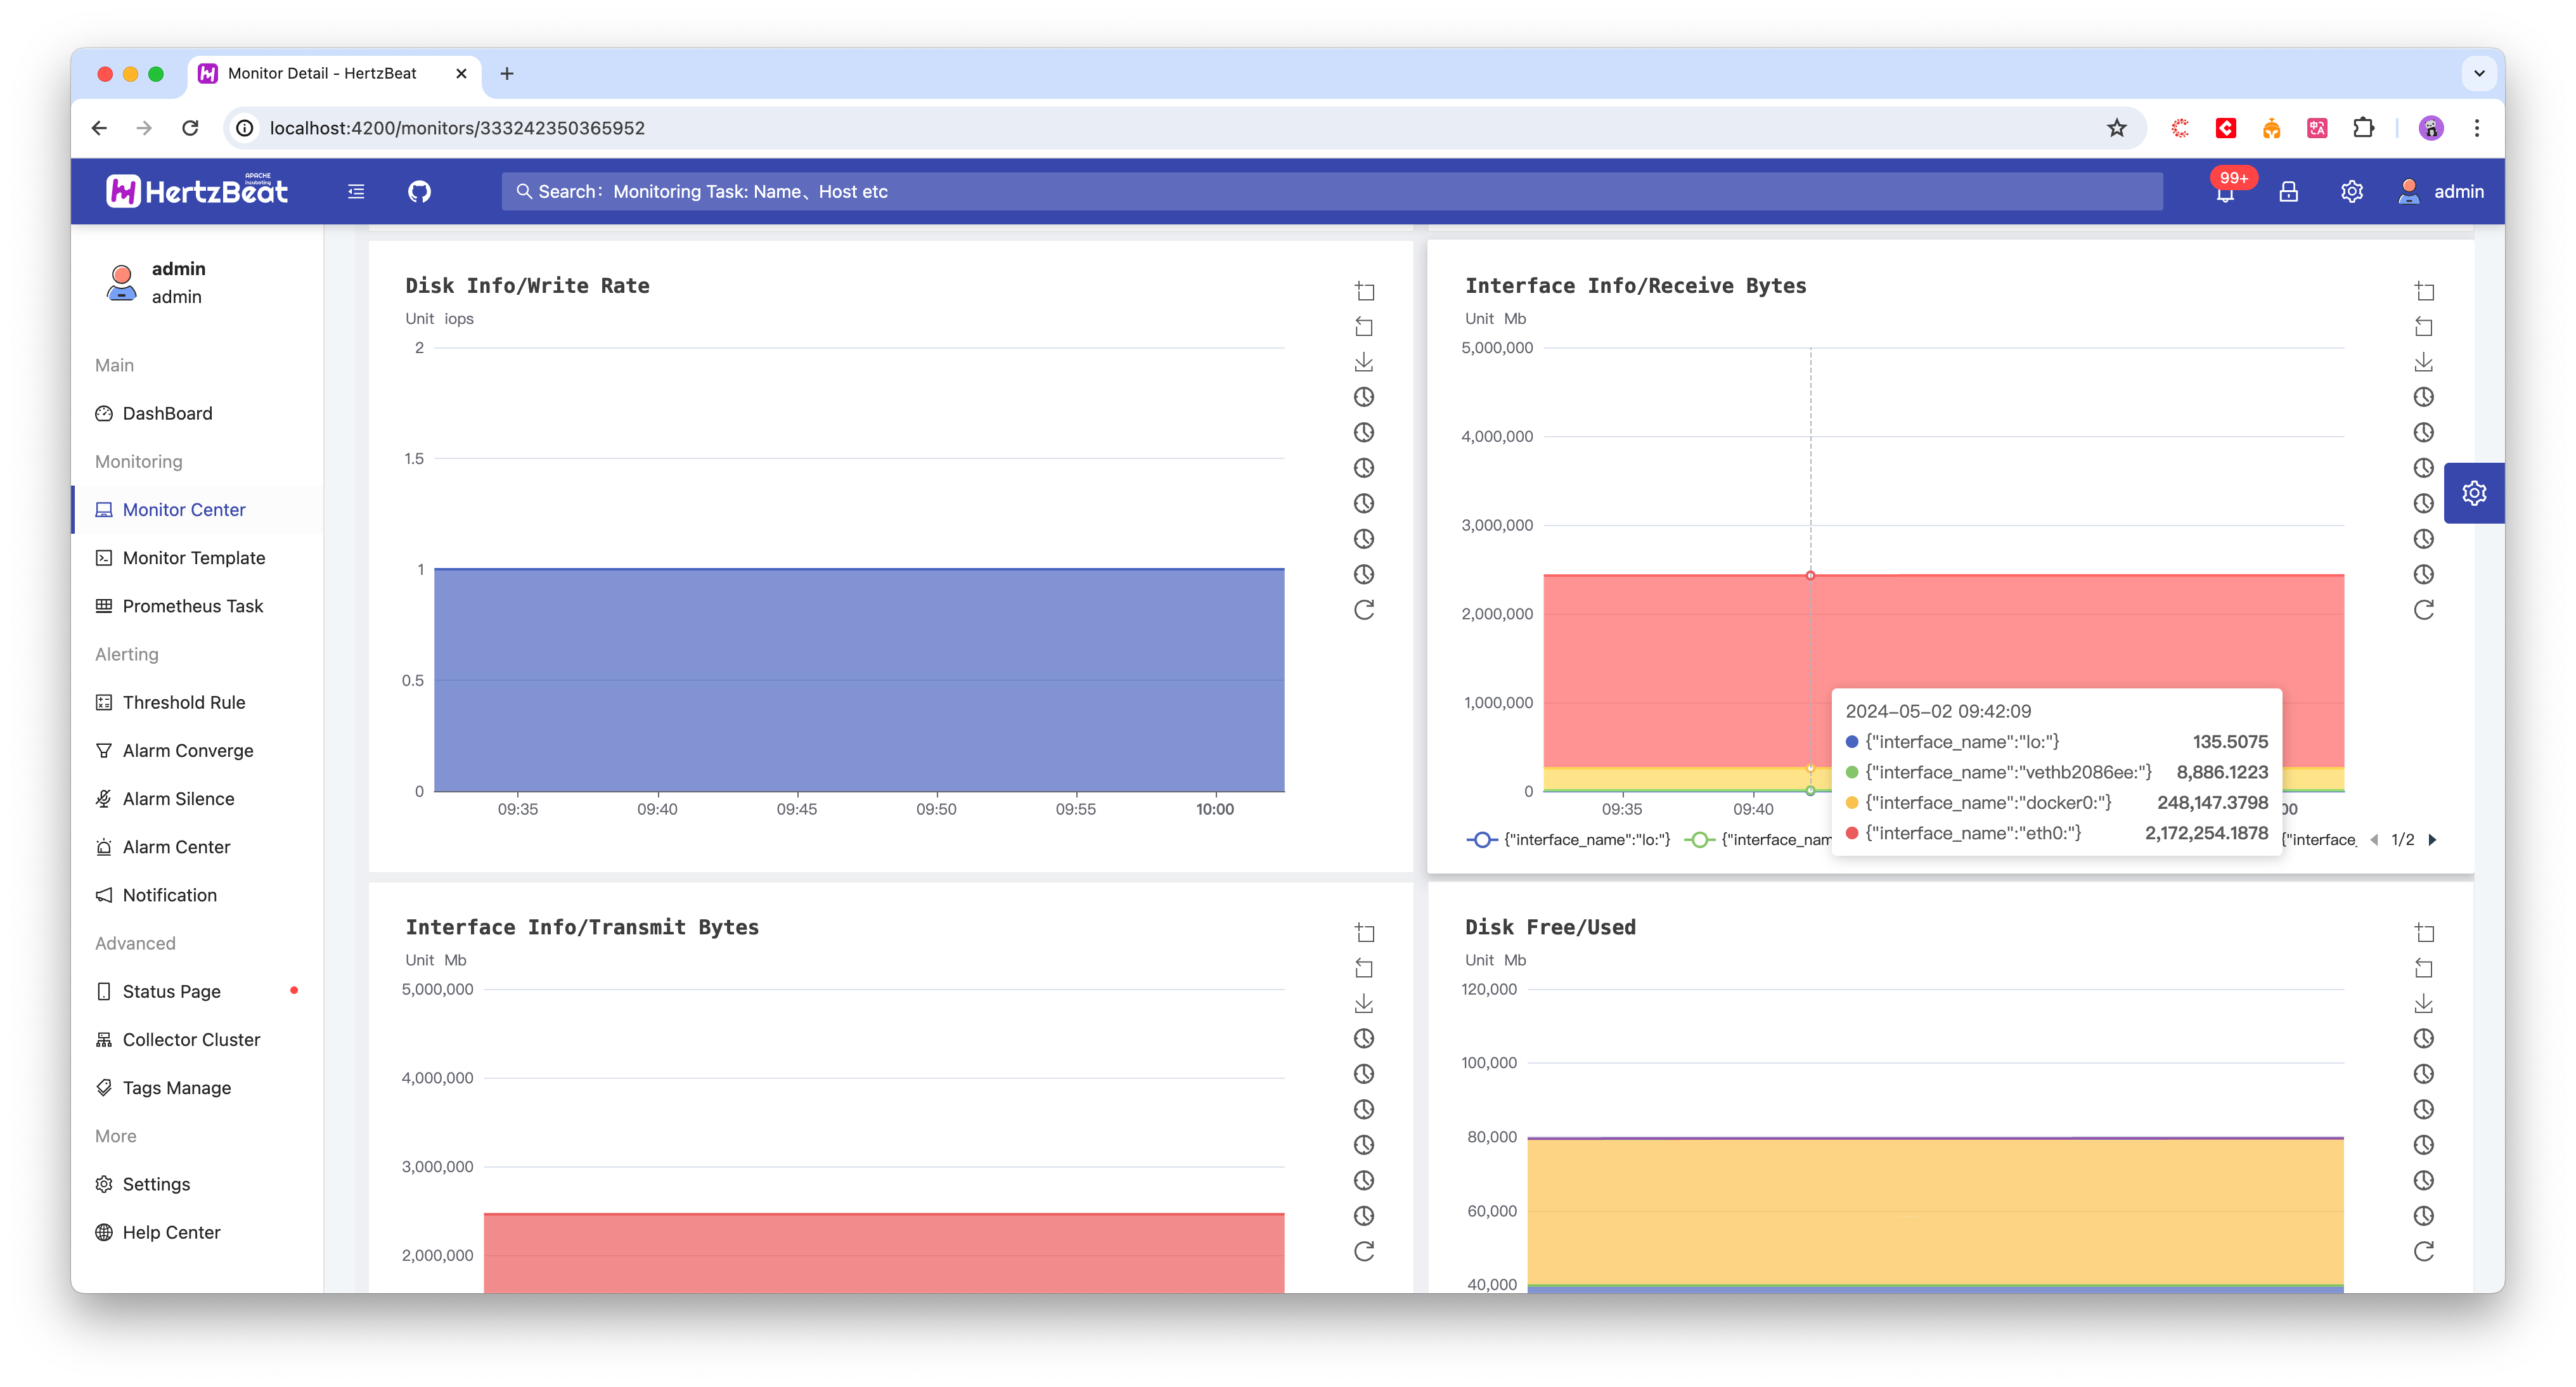
- Monitor Historical Data Report displays the historical values of the currently monitored metrics in the form of trend charts, supports querying hourly, daily and monthly historical data, and supports configuring the page refresh time.
- ⚠️ Note that the monitoring history charts need to be configured with an external timing database in order to get the full functionality, timing database support: IOTDB, TDengine, InfluxDB, GreptimeDB
Alarm Center
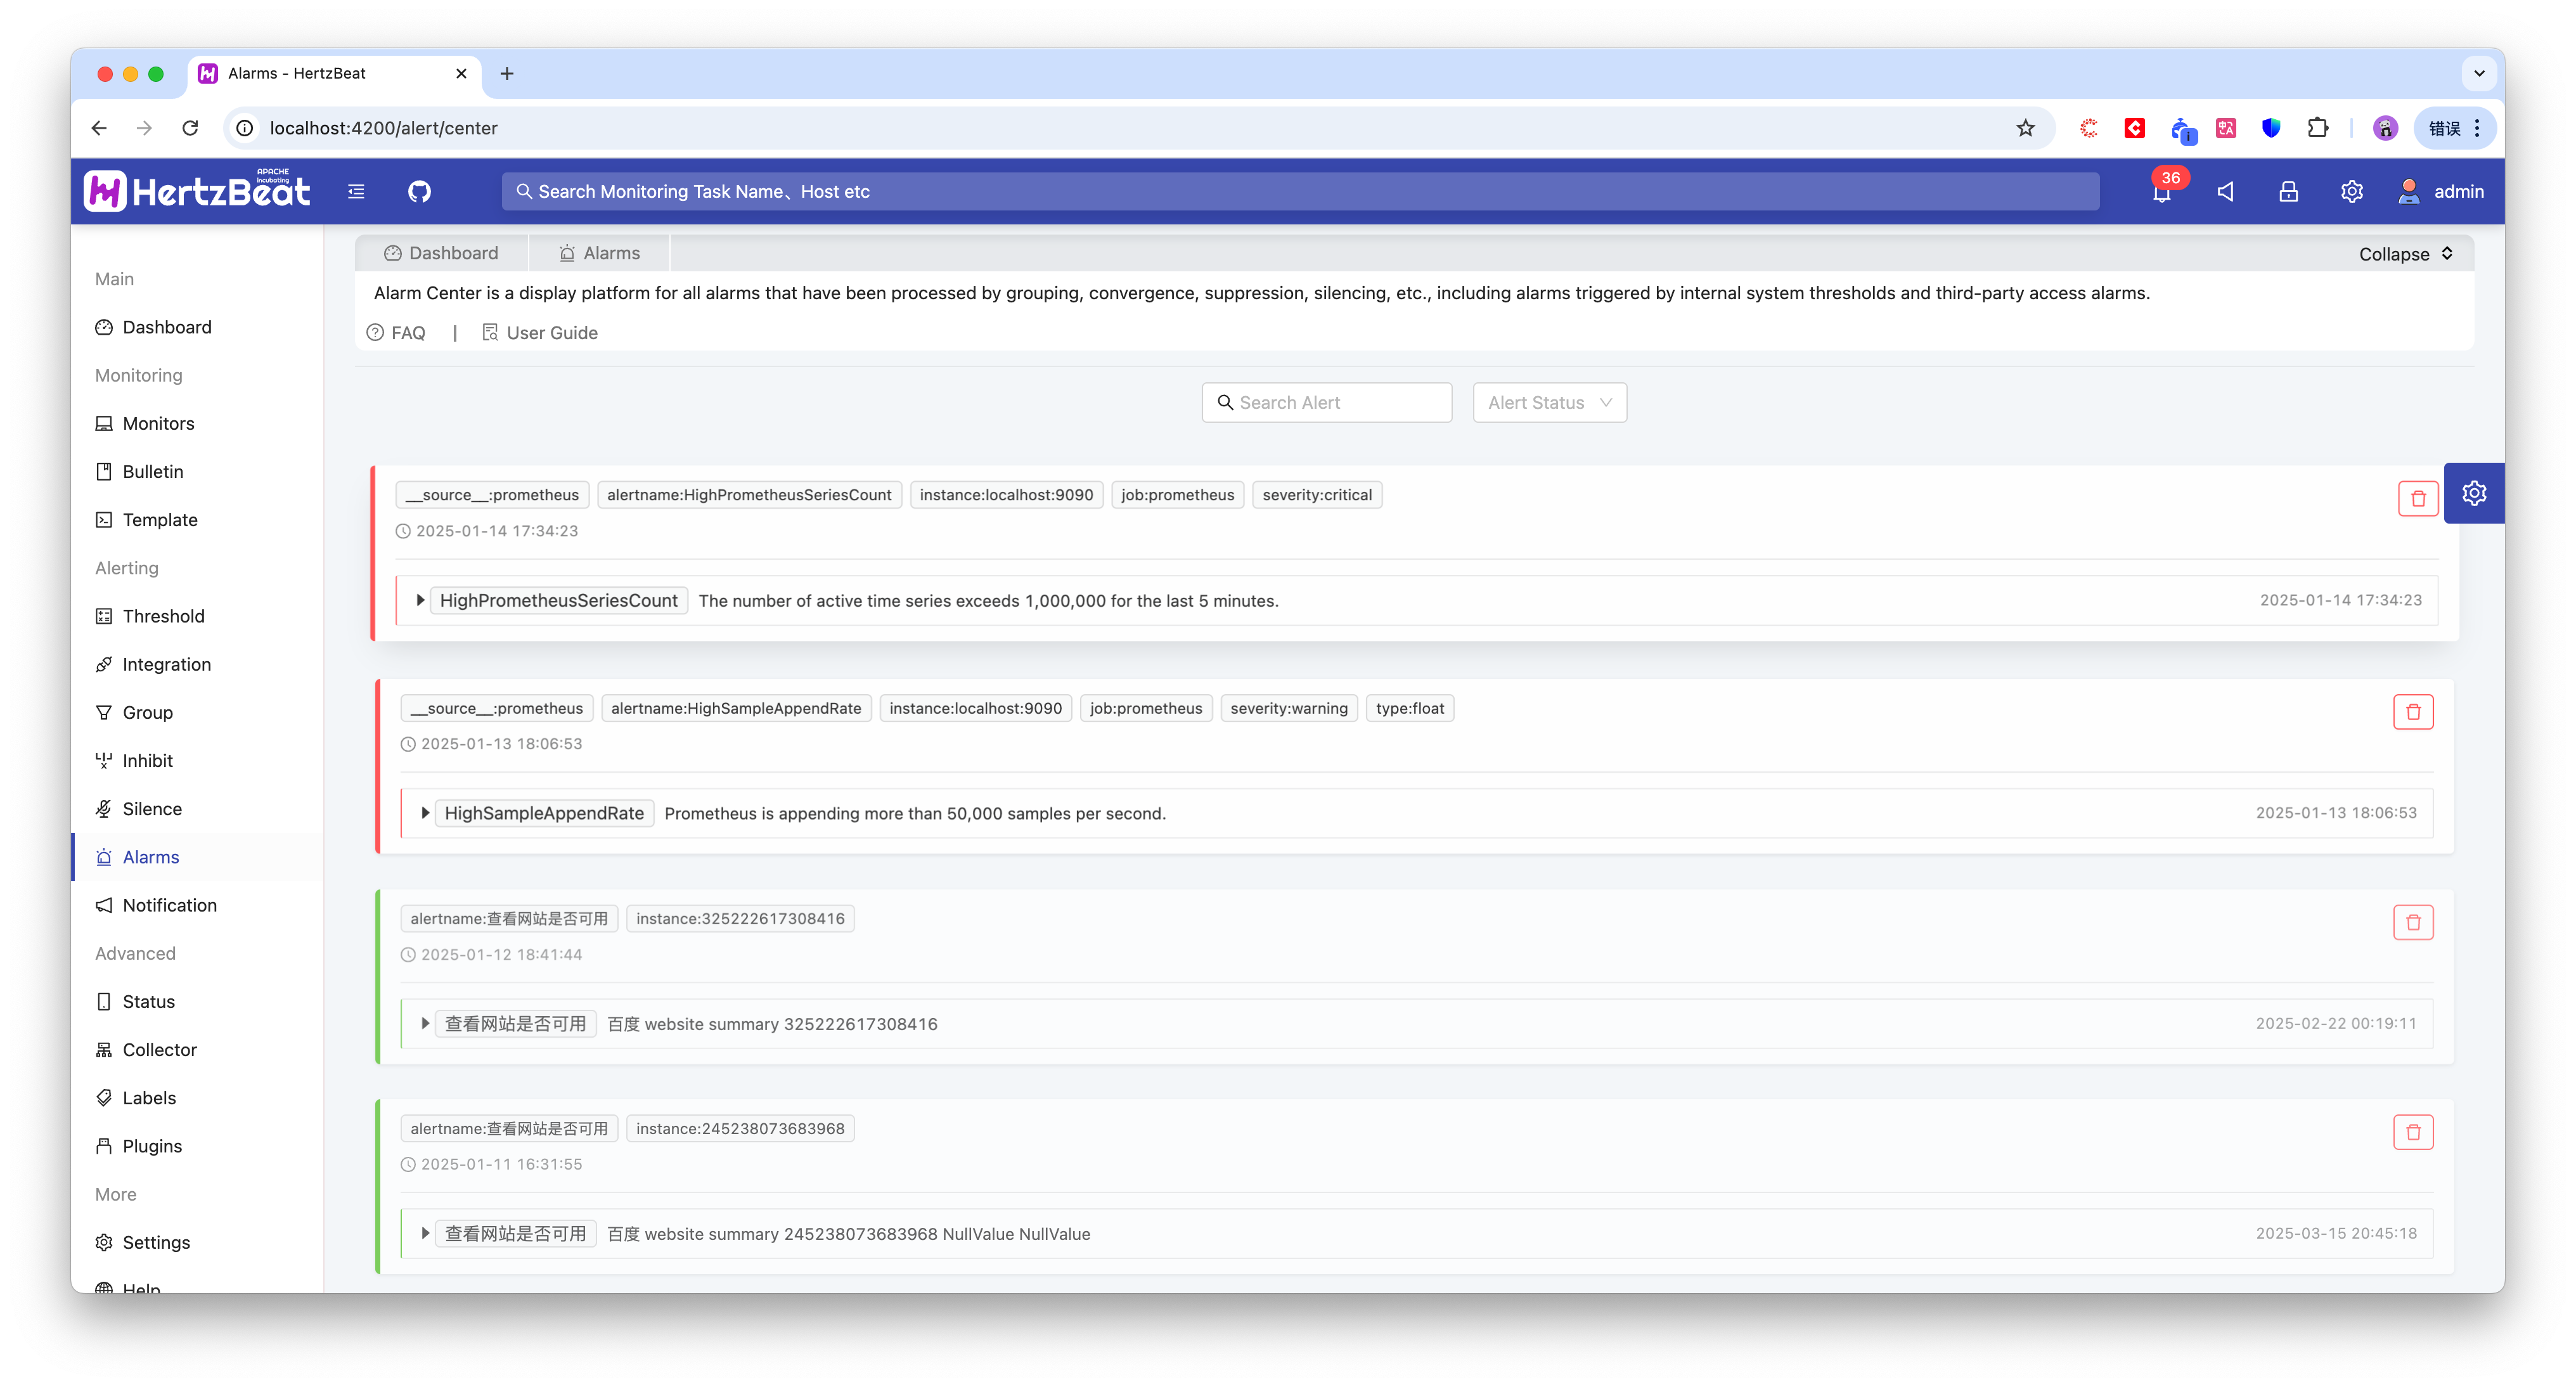
- The management display page of triggered alarm messages enables users to visualize the current alarm situation.
- Support alarm processing, alarm marking unprocessed, alarm deletion, clearing and other batch operations.
Threshold Rules
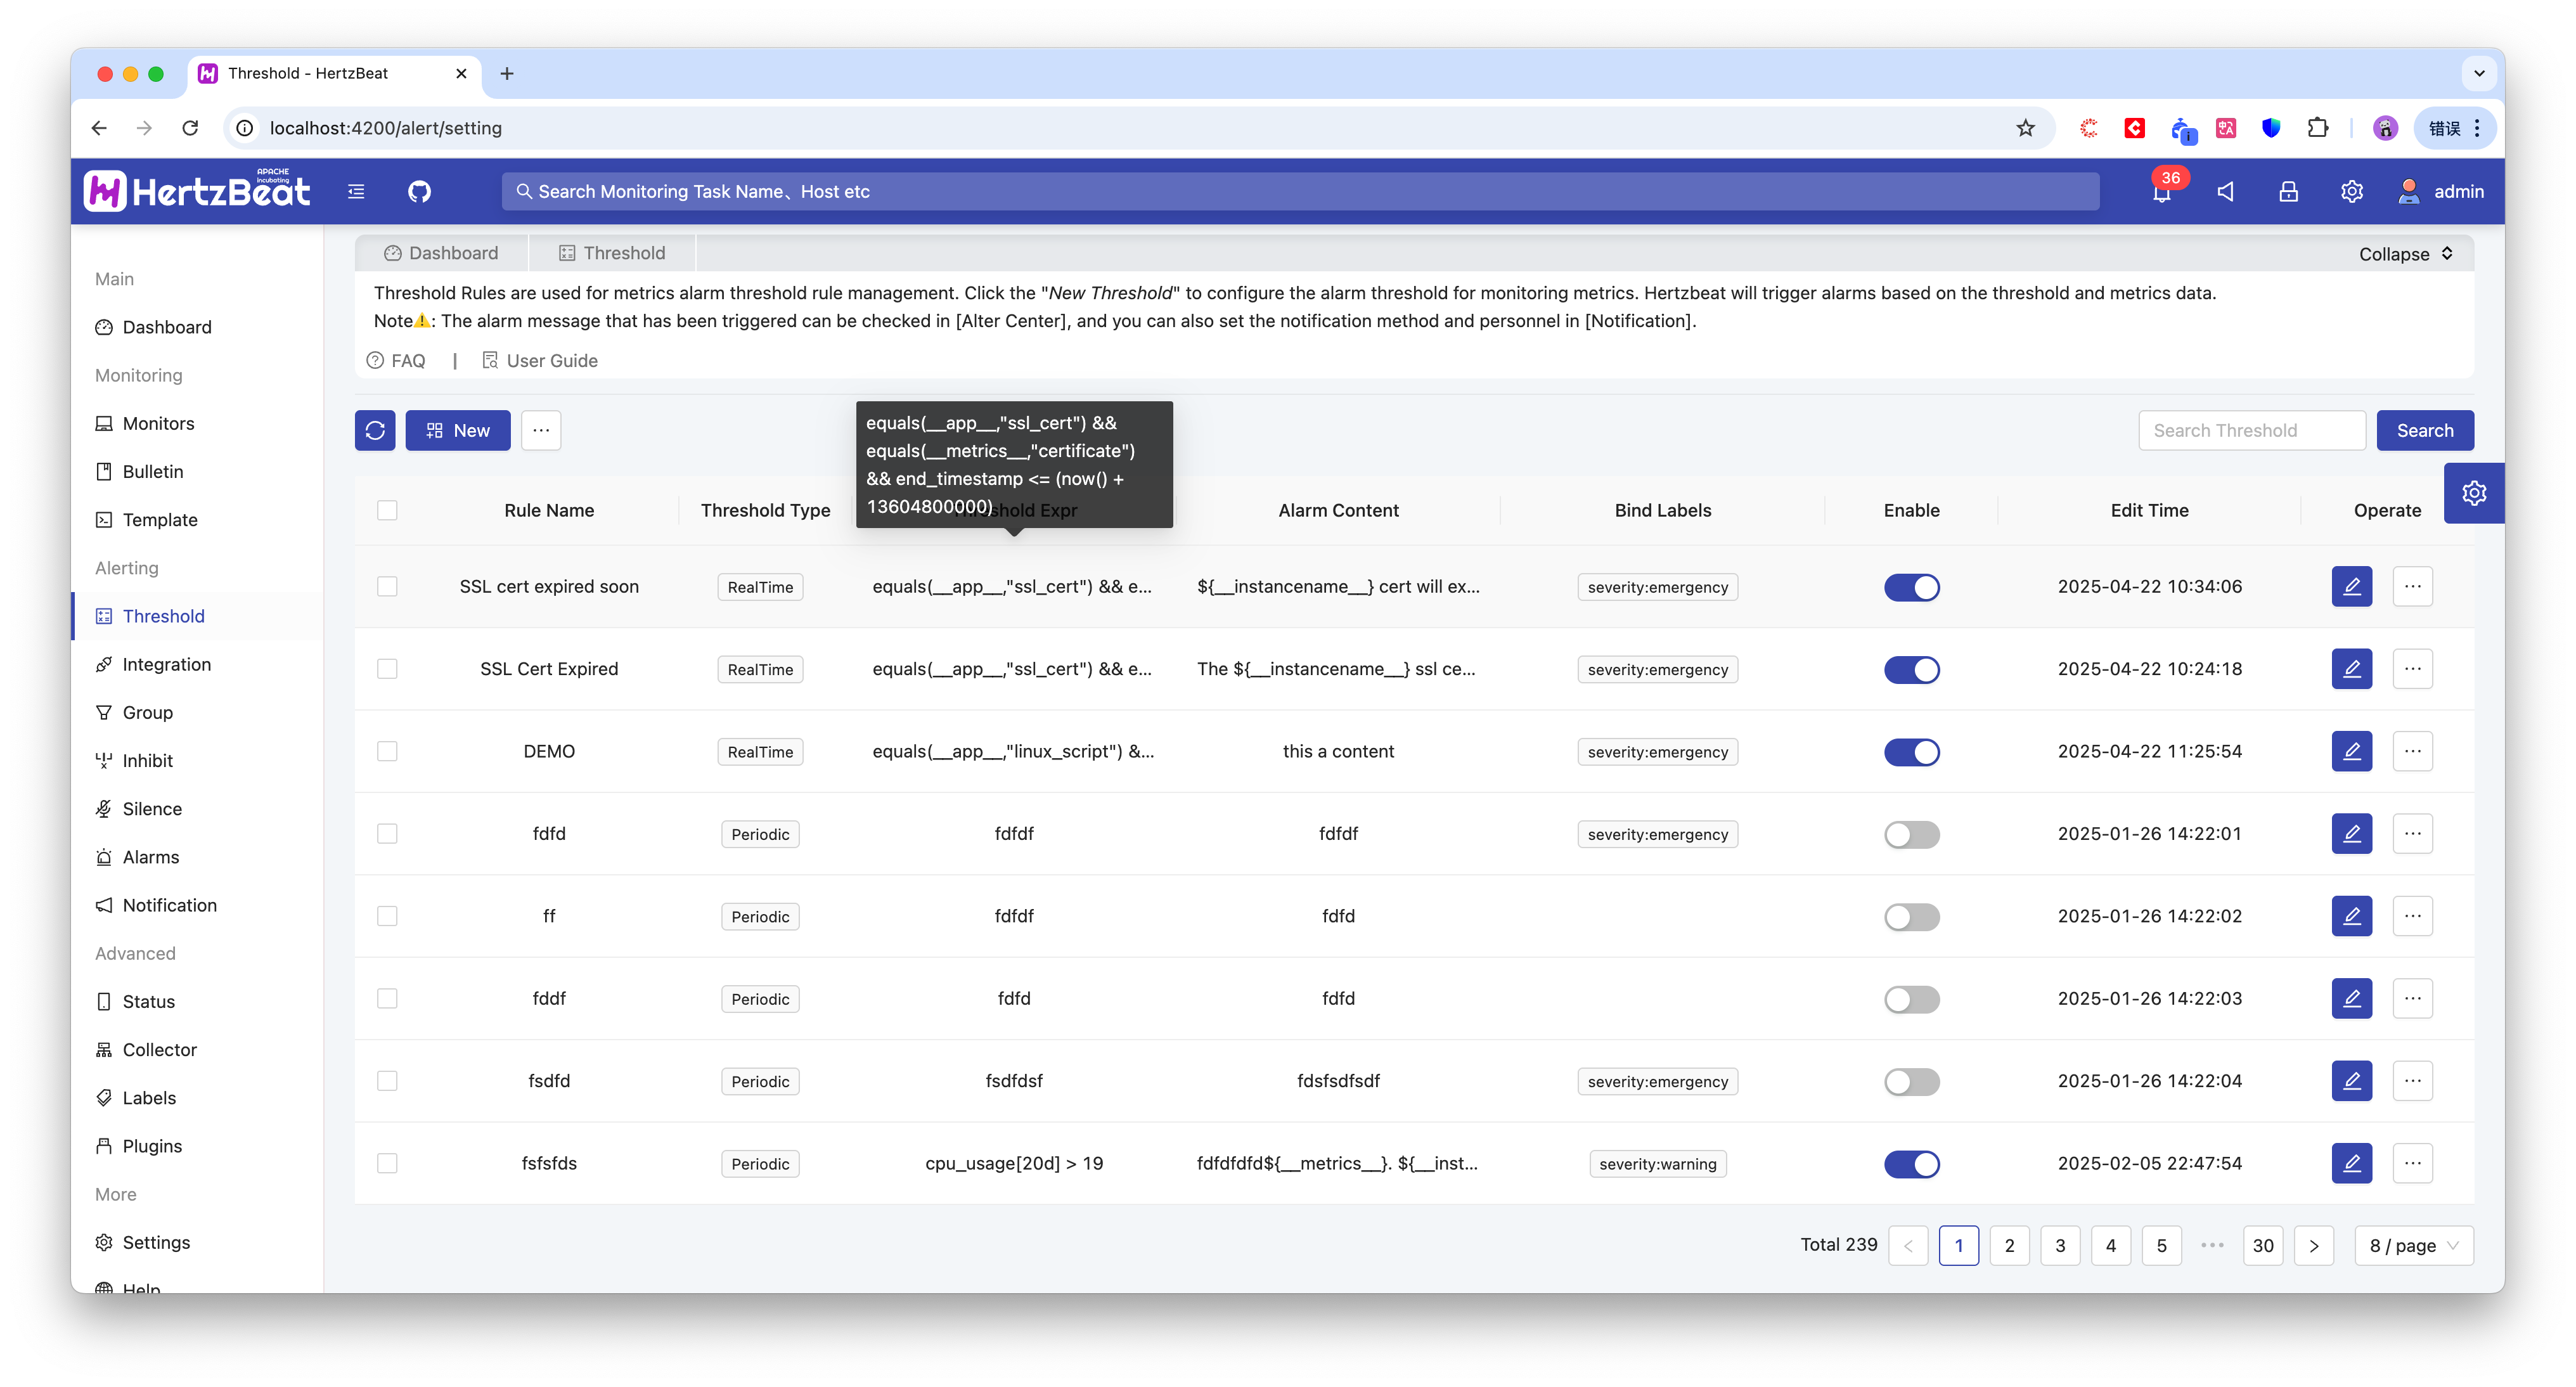
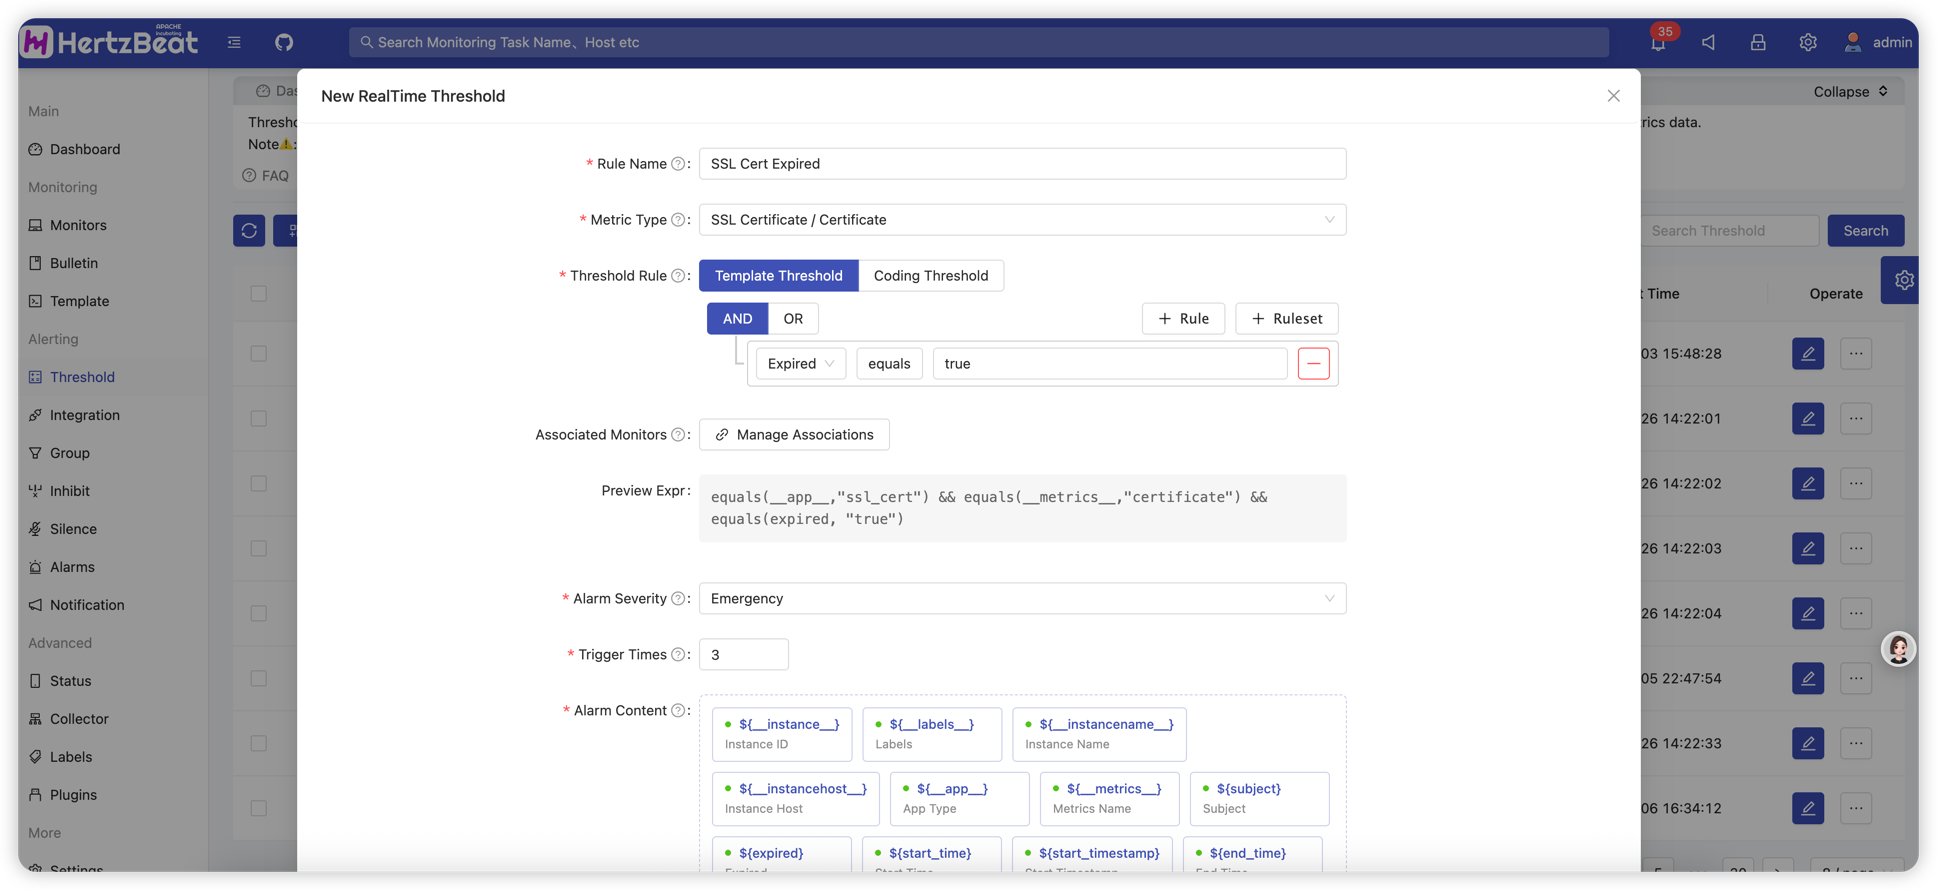
- Threshold rules can be configured for monitoring the availability status, and alerts can be issued when the value of a particular metric exceeds the expected range.
- There are three levels of alerts: notification alerts, critical alerts, and emergency alerts.
- Threshold rules support visual page configuration or expression rule configuration for more flexibility.
- It supports configuring the number of triggers, alarm levels, notification templates, associated with a specific monitor and so on.
Alarm Convergence
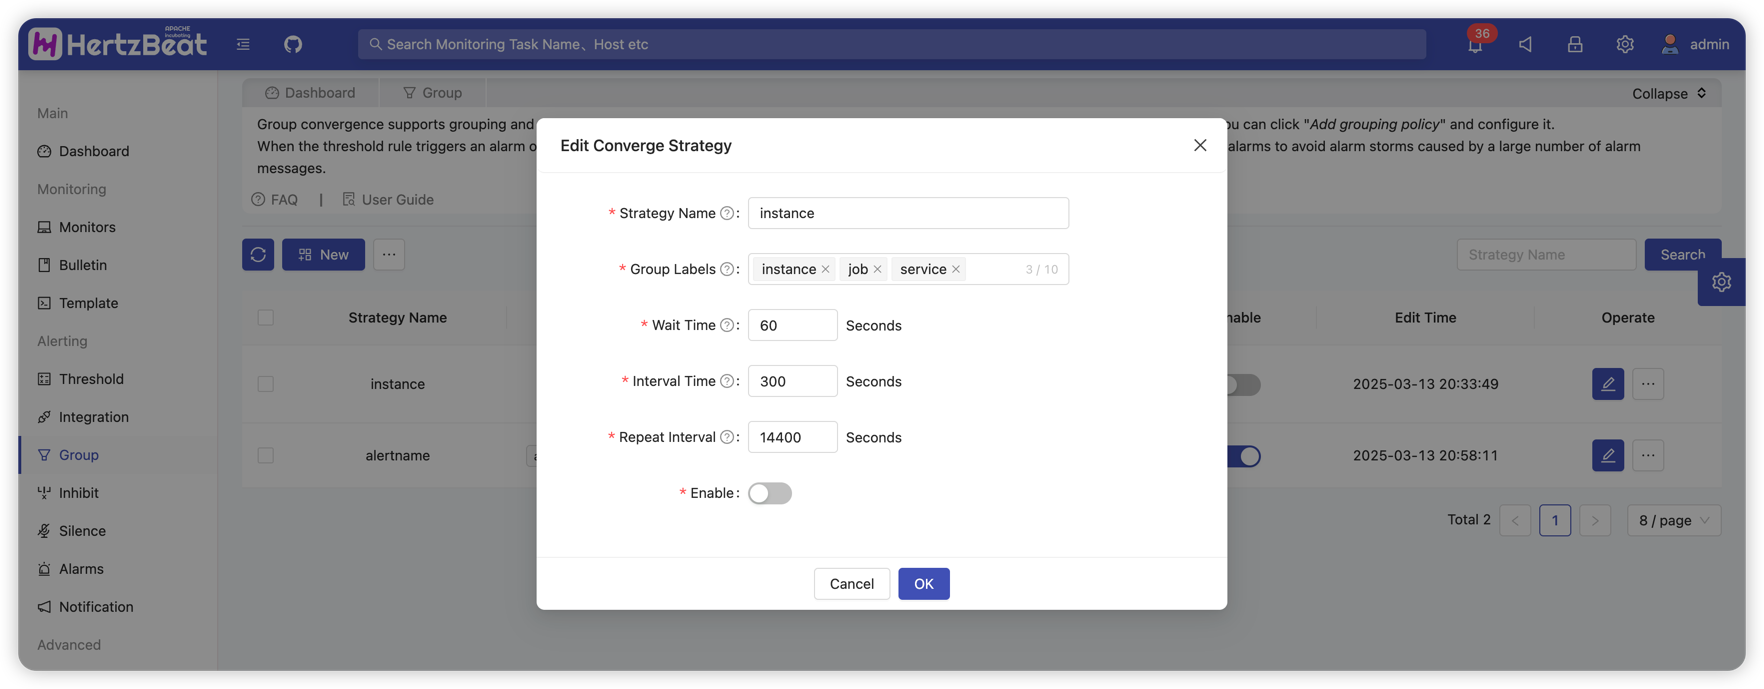
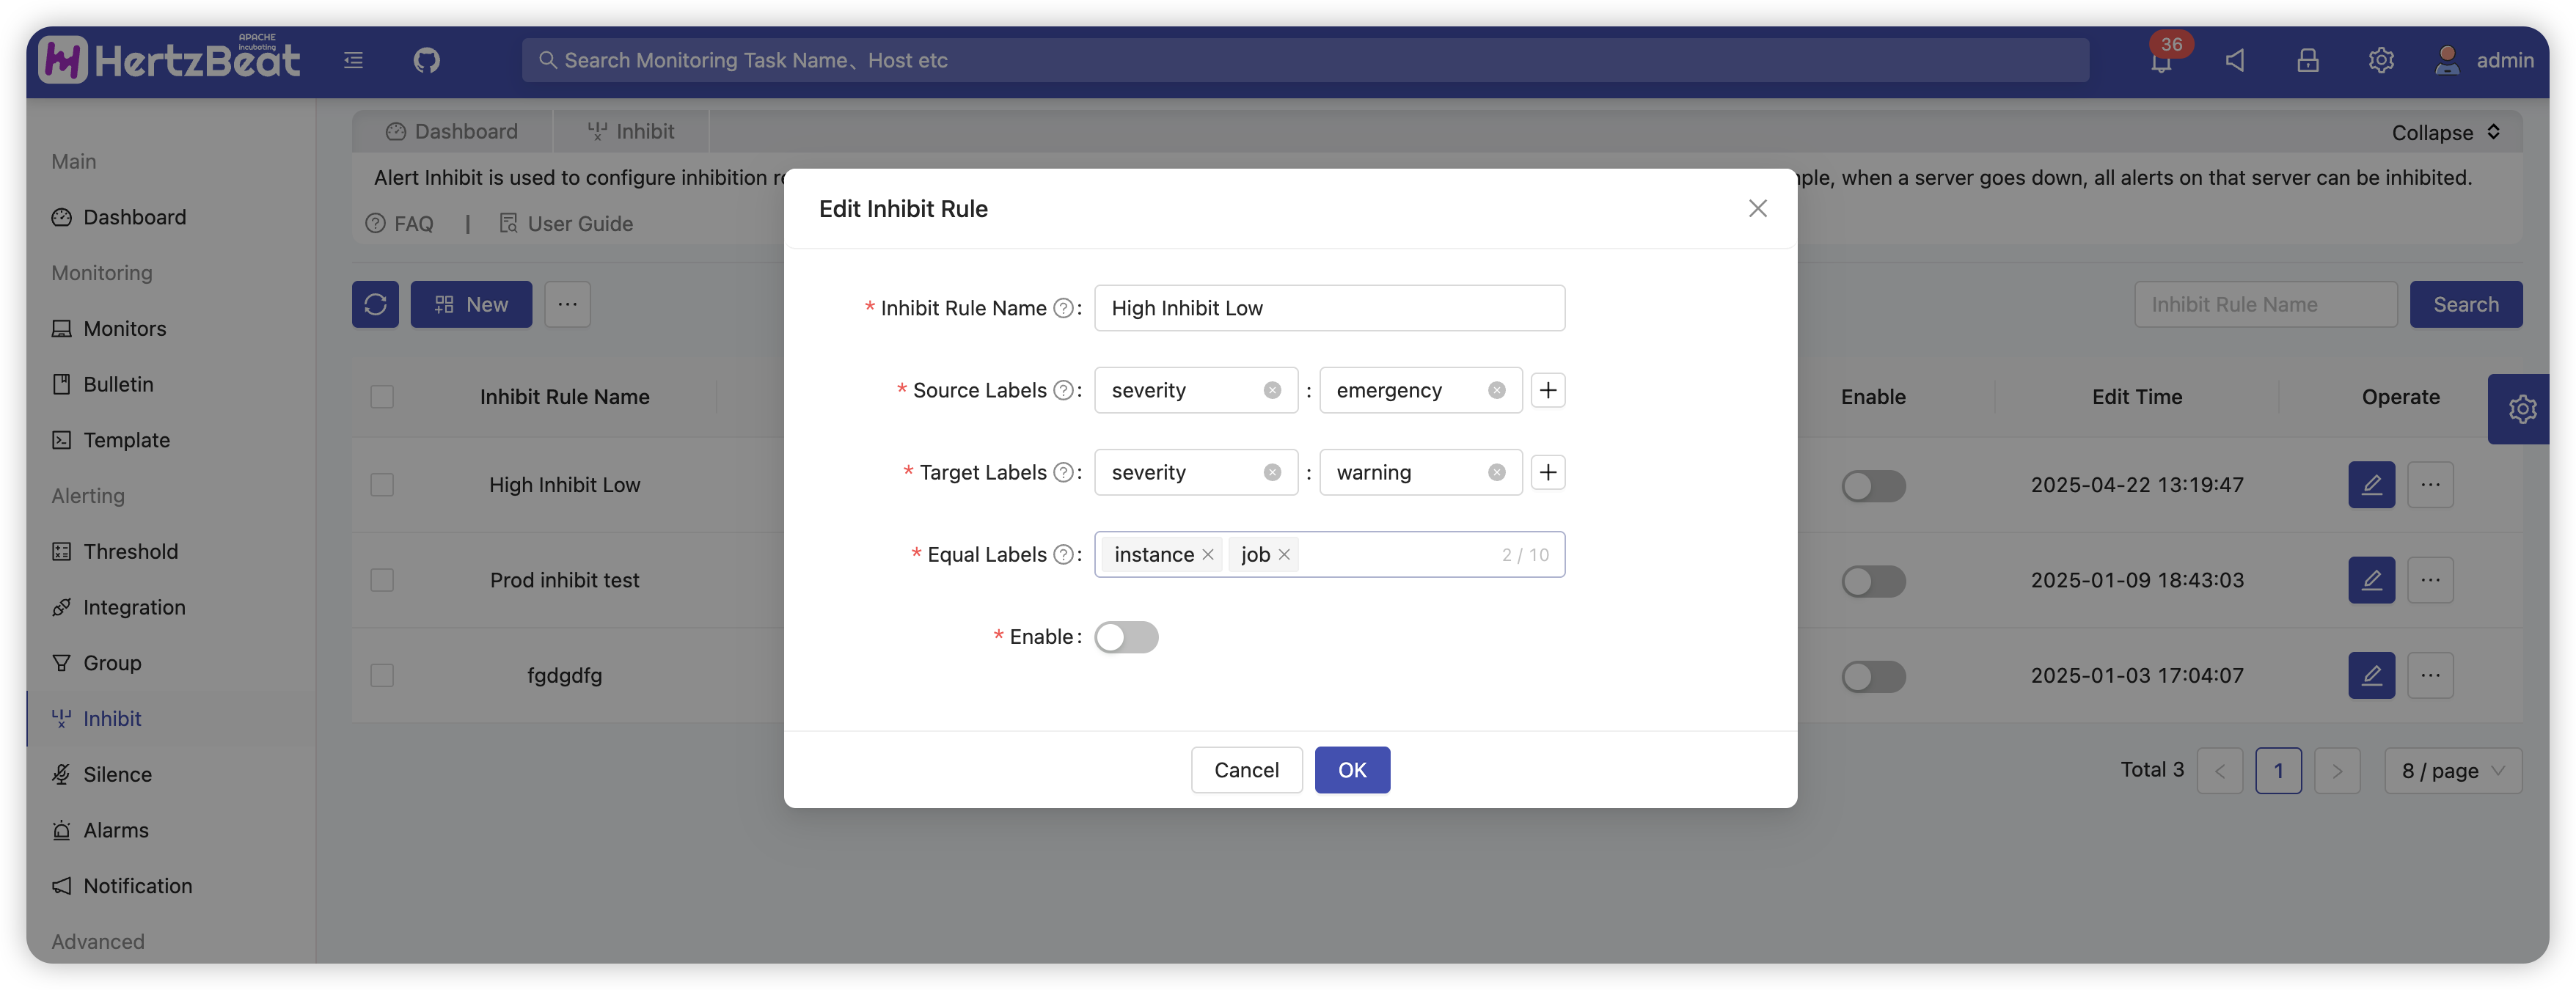
- When the alarm is triggered by the threshold rule, it will enter into the alarm convergence, the alarm convergence will be based on the rules of the specific time period of the duplicate alarm message de-emphasis convergence, to avoid a large number of repetitive alarms lead to the receiver alarm numbness.
- Alarm convergence rules support duplicate alarm effective time period, label matching and alarm level matching filter.
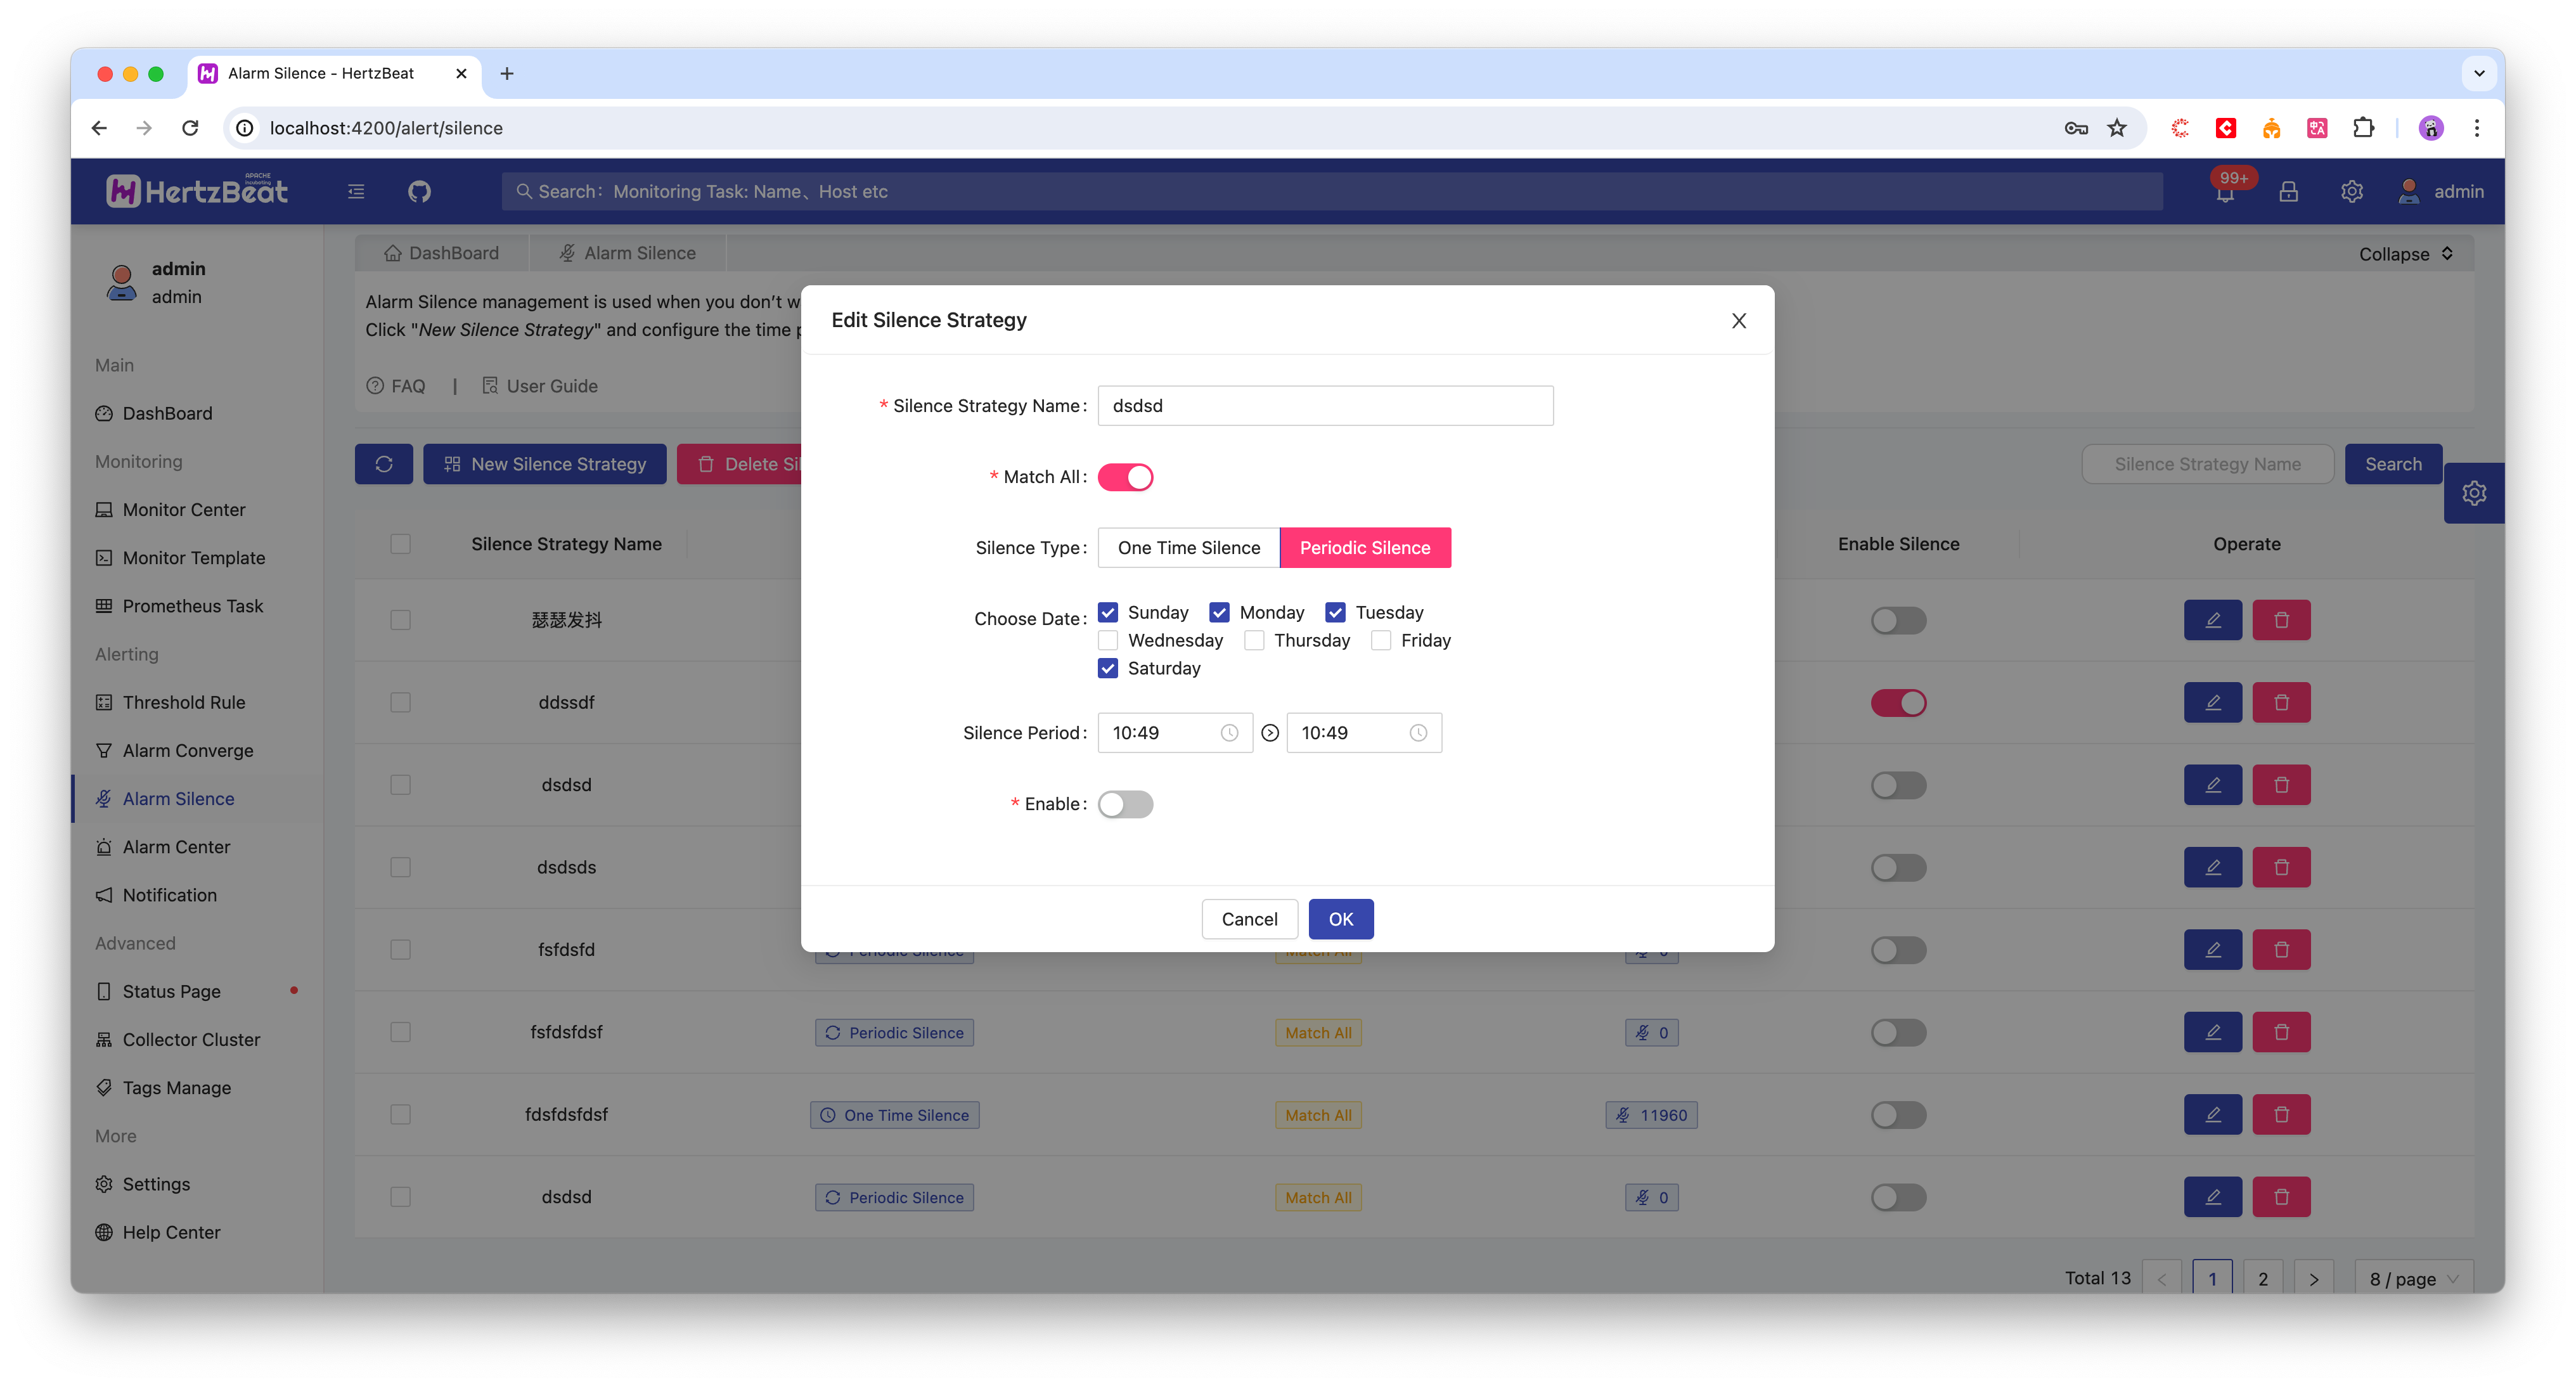
Alarm Silence
- When the alarm is triggered by the threshold rule, it will enter into the alarm silence, the alarm silence will be based on the rules of a specific one-time time period or periodic time period of the alarm message blocking silence, this time period does not send alarm messages.
- This application scenario, such as users in the system maintenance, do not need to send known alarms. Users will only receive alarm messages on weekdays, and users need to avoid disturbances at night.
- Alarm silence rules support one-time time period or periodic time period, support label matching and alarm level matching.
Message Notification
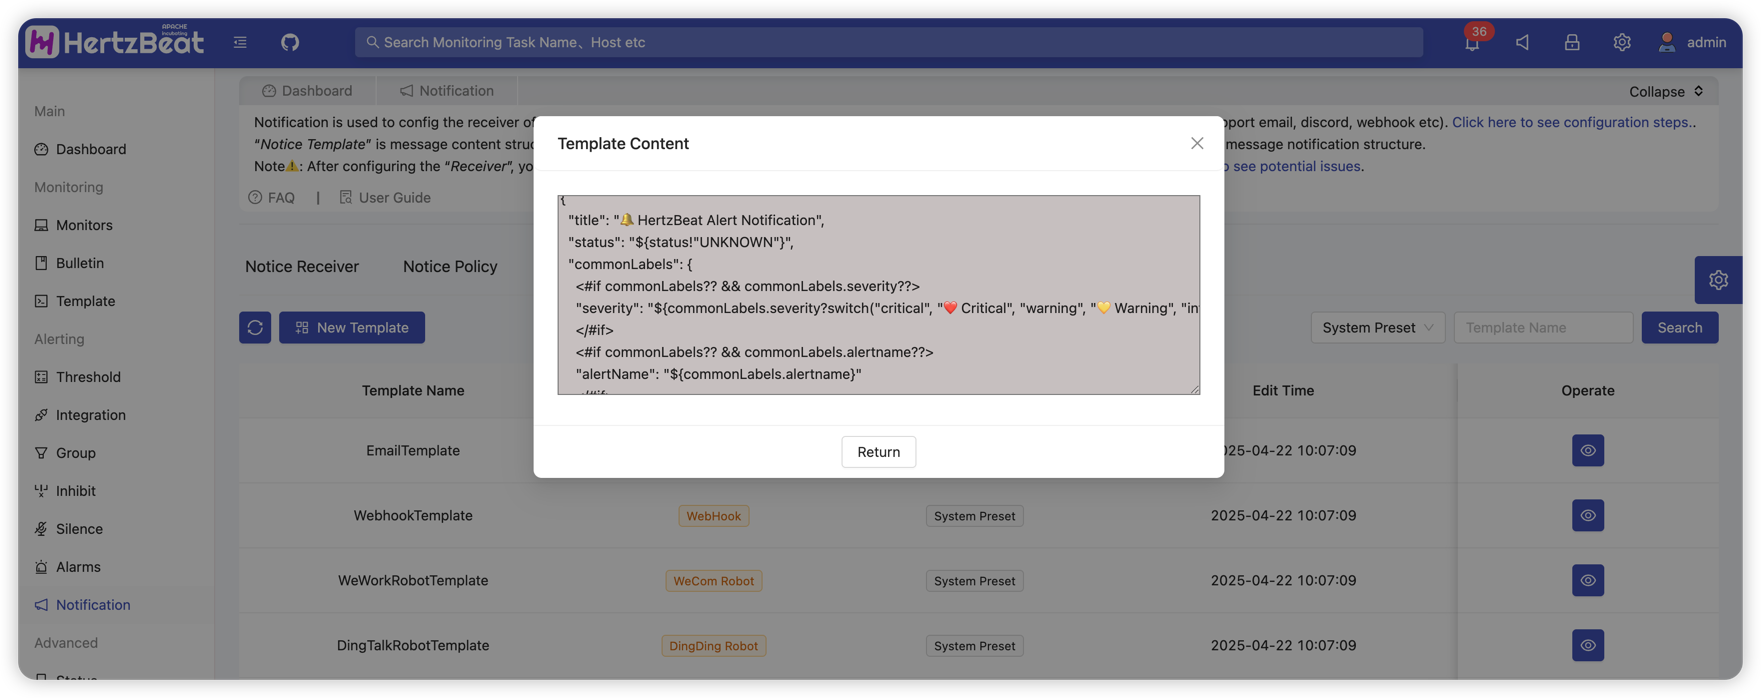
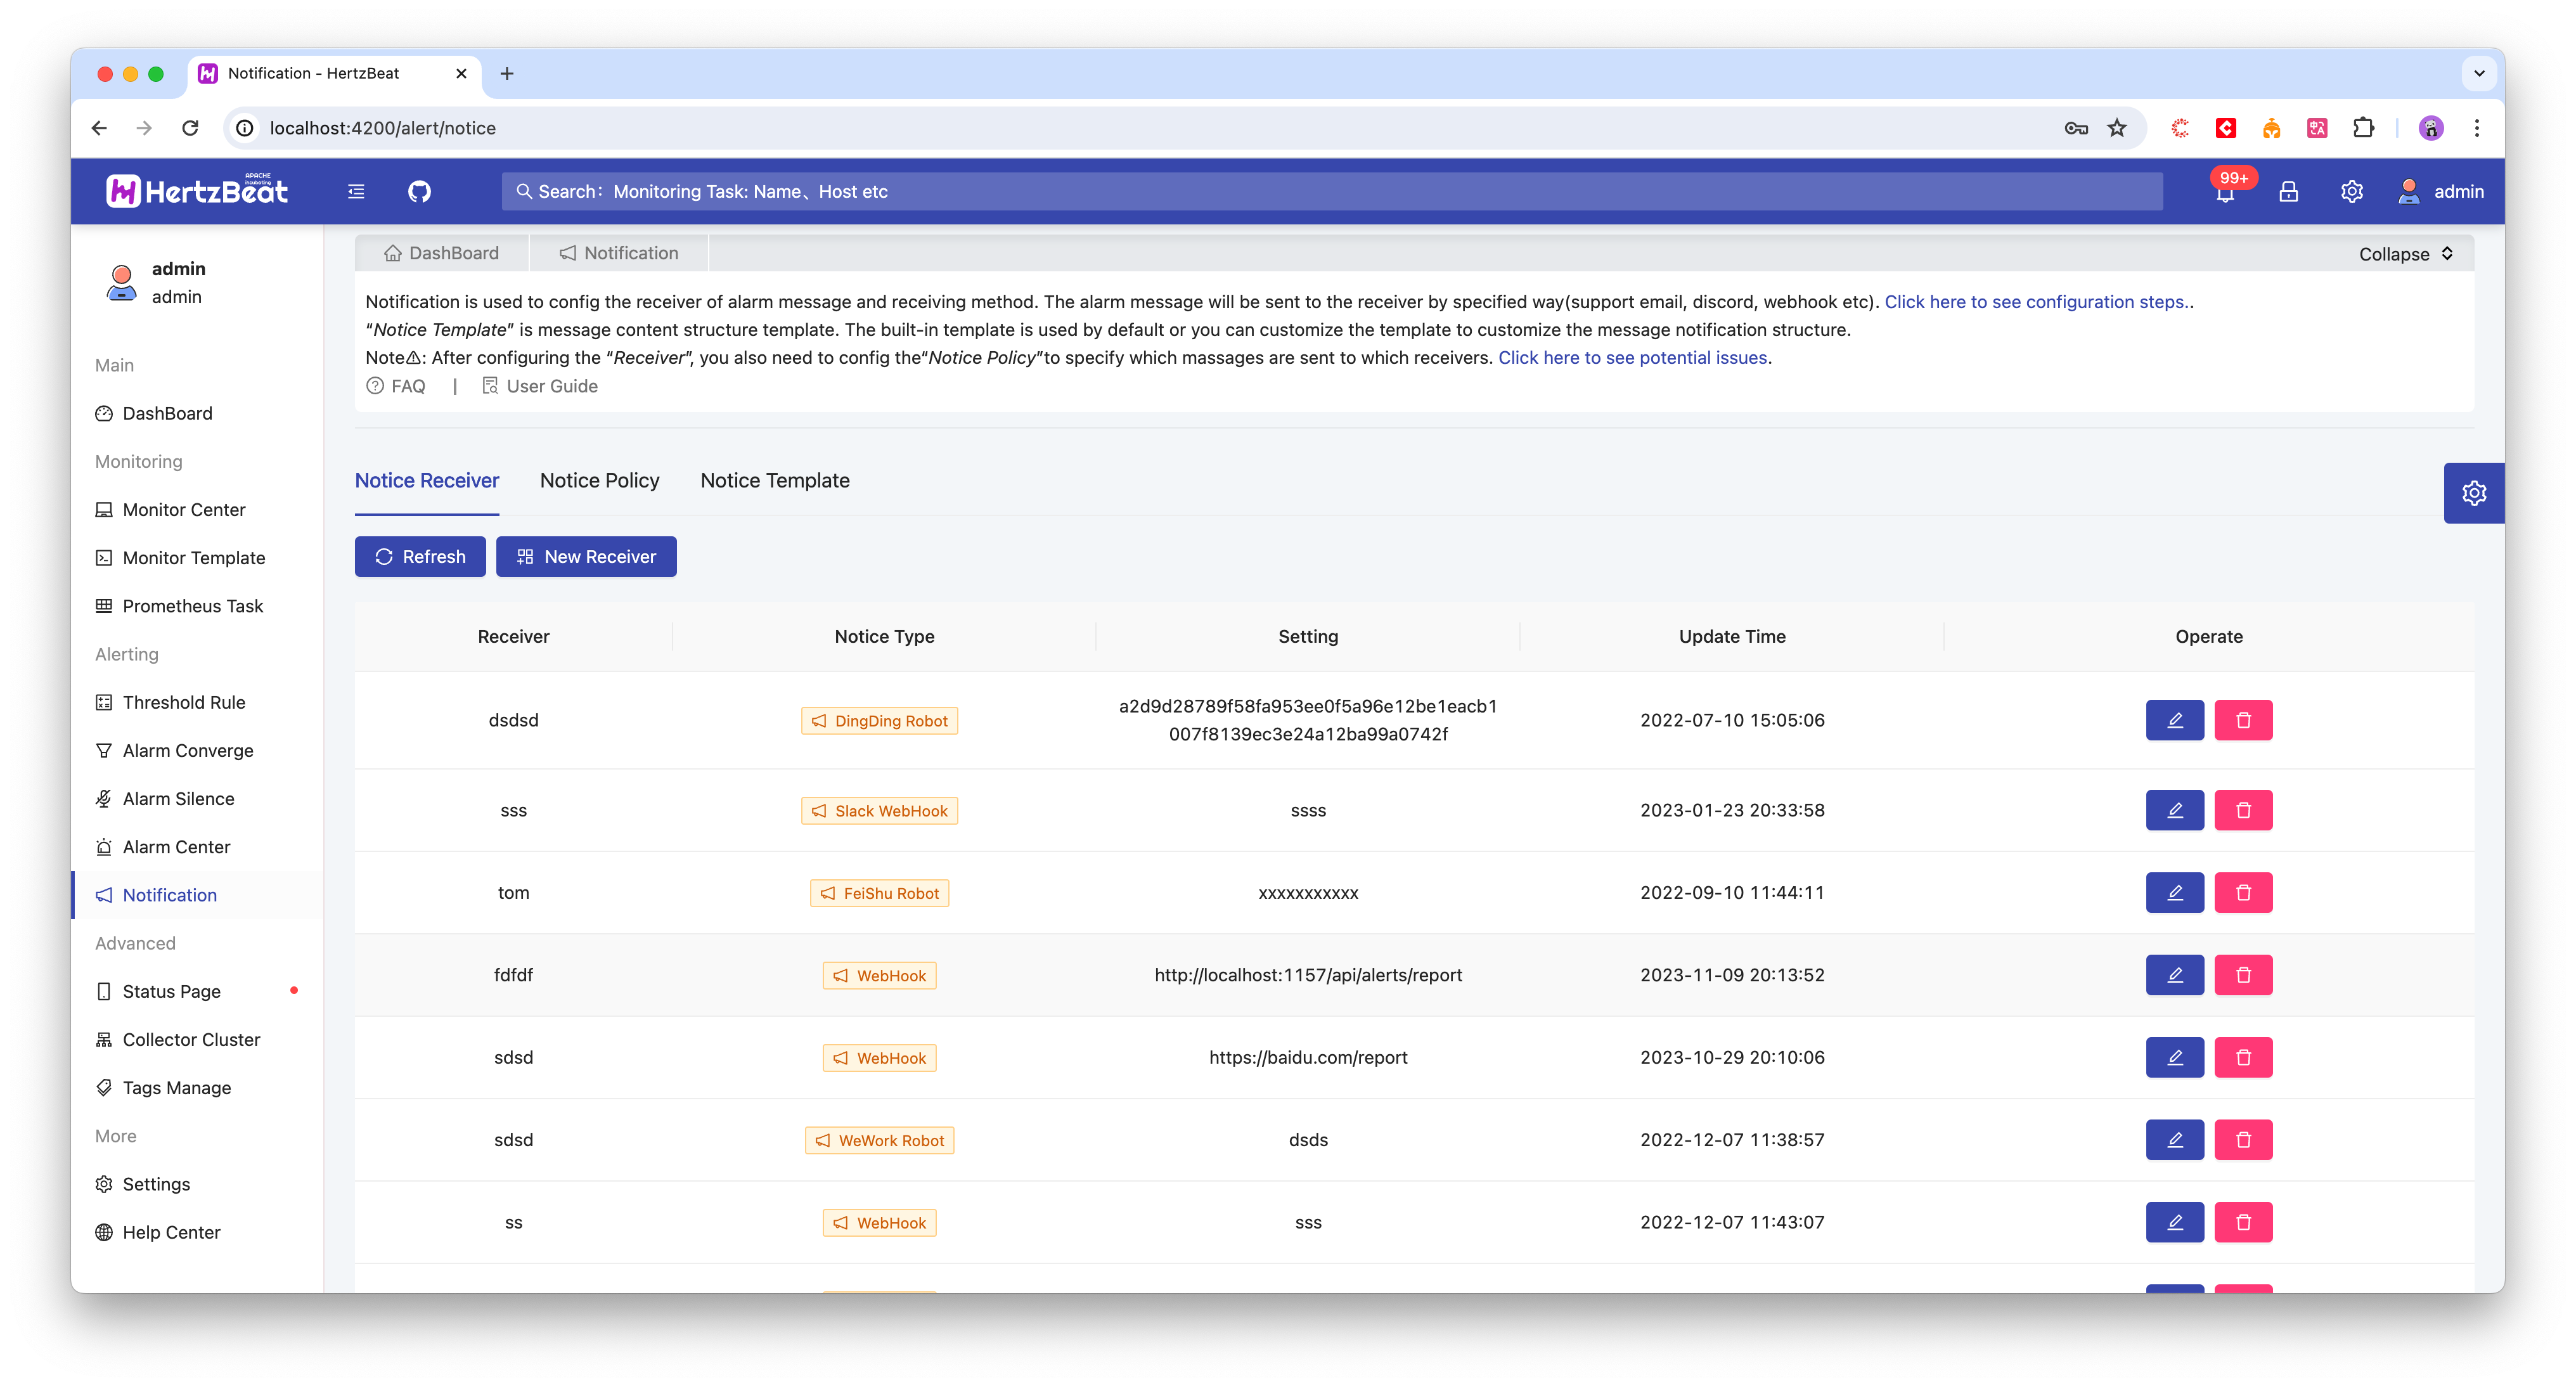
- Message notification is a function to notify alarm messages to specified recipients through different media channels, so that the alarm messages can reach them in time.
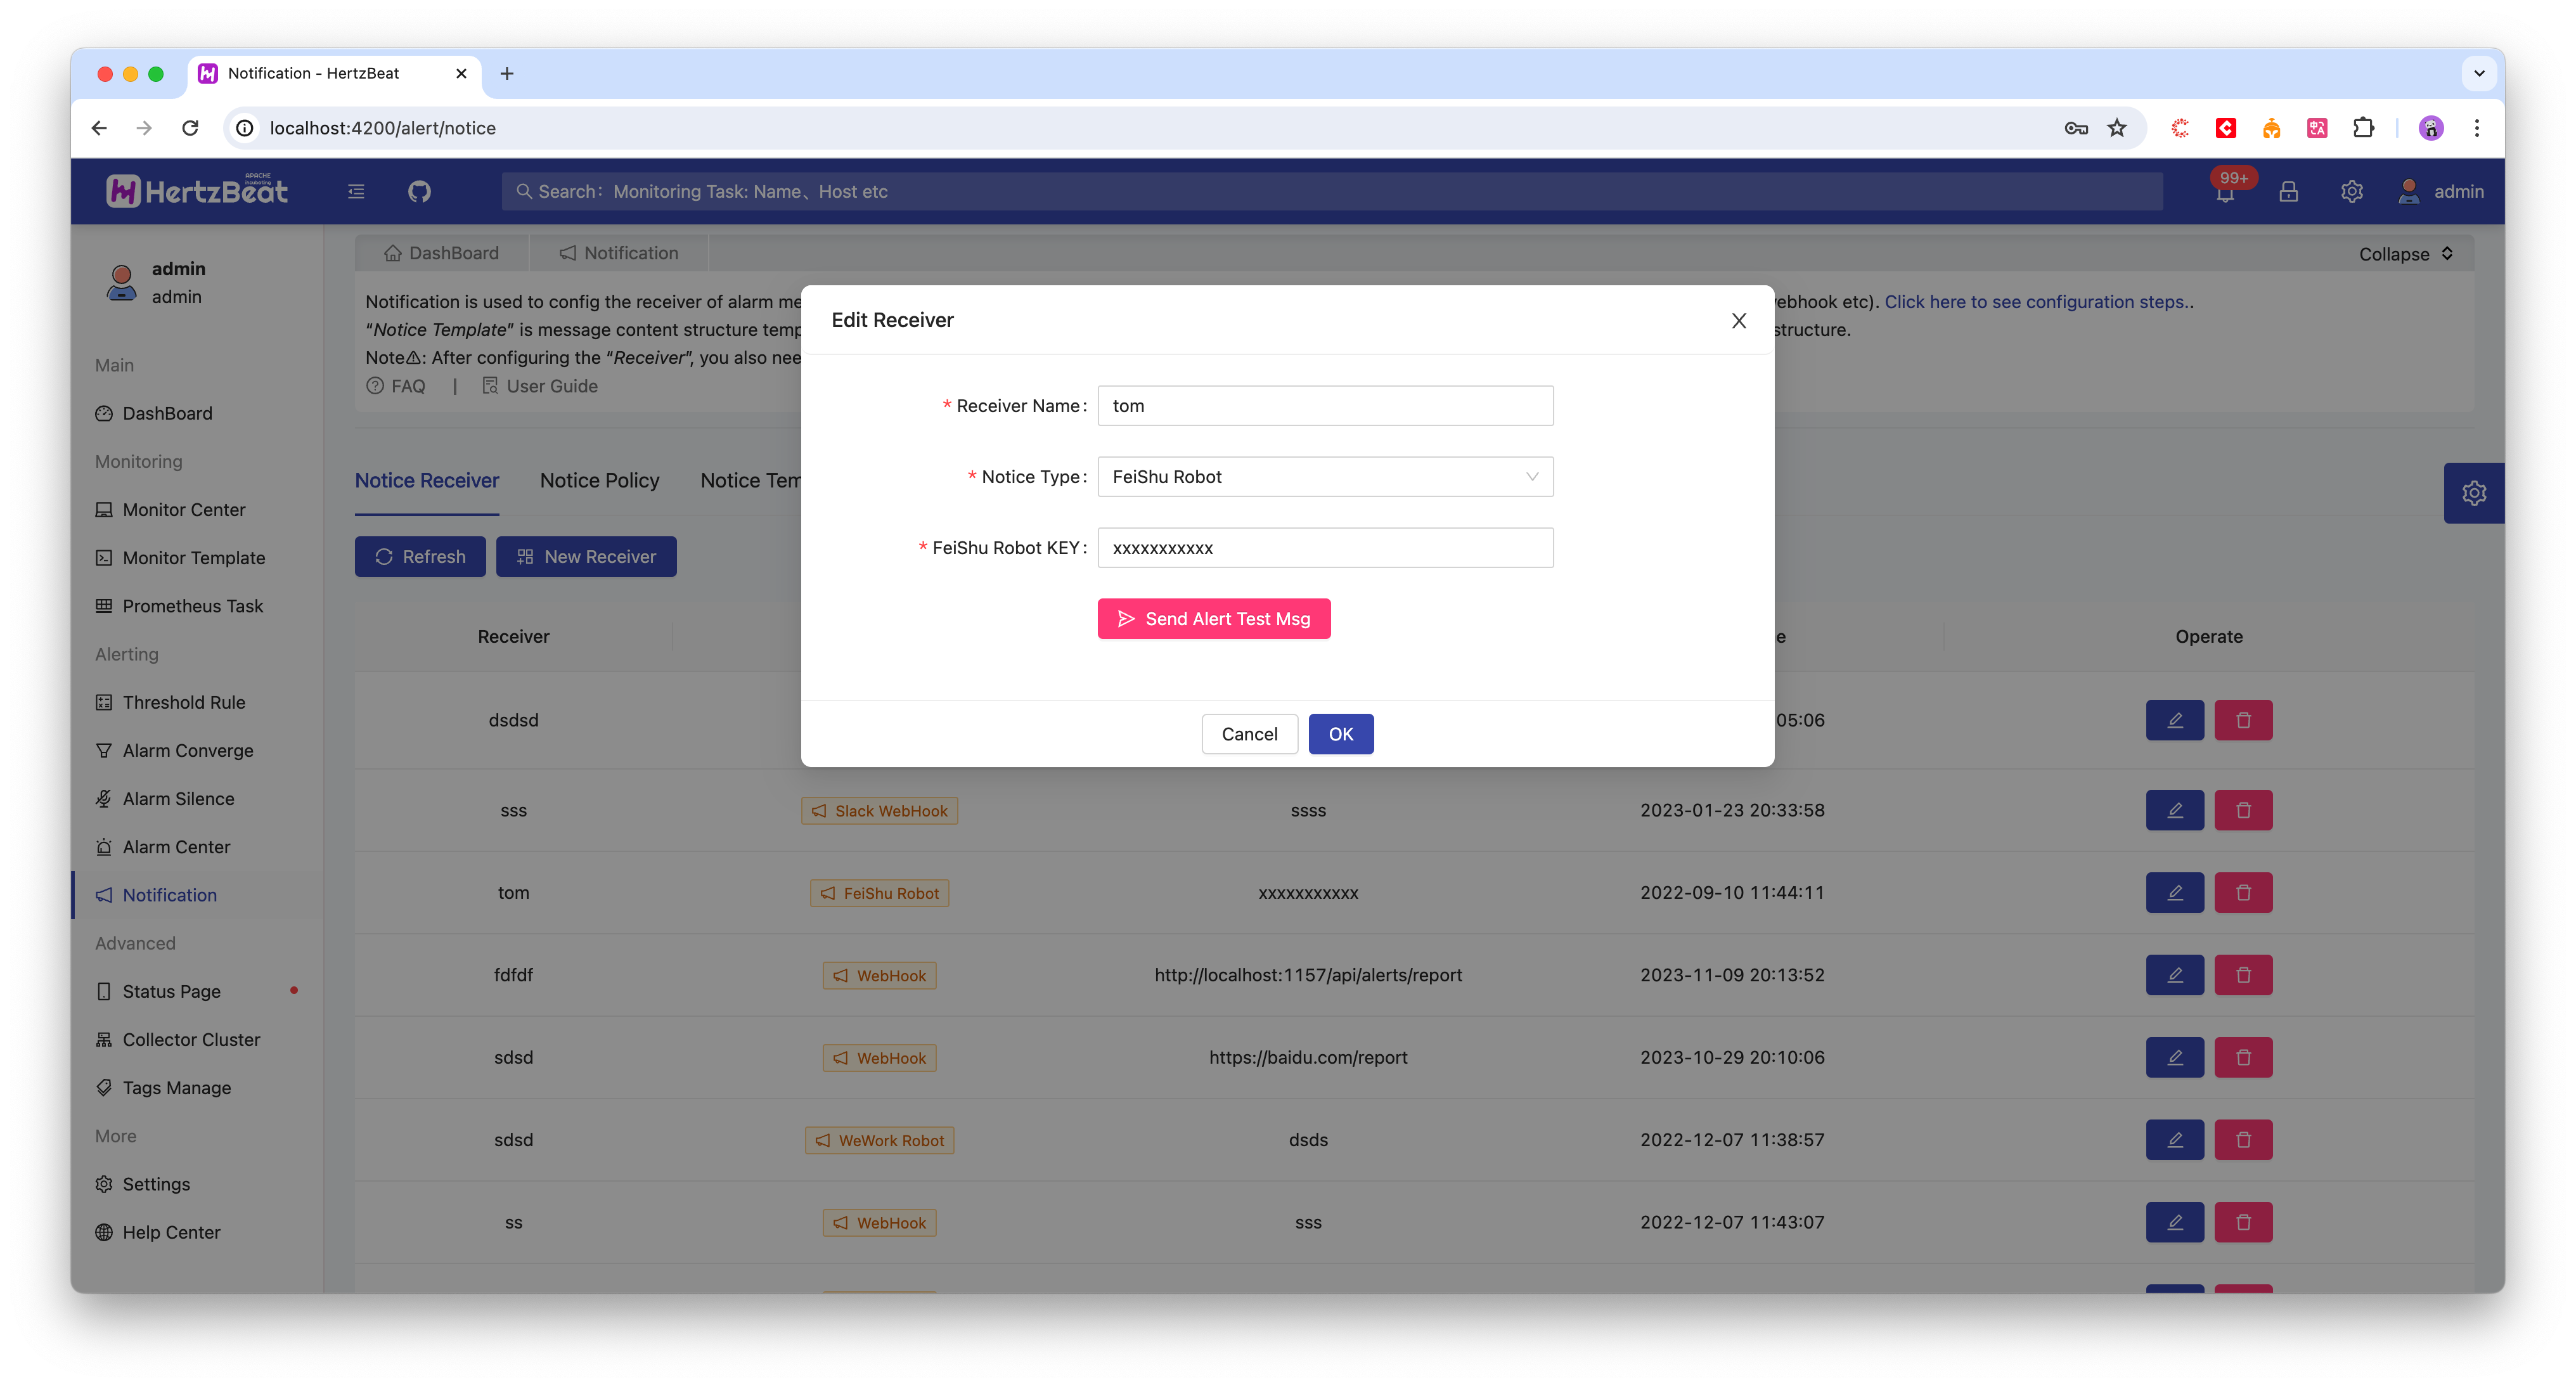
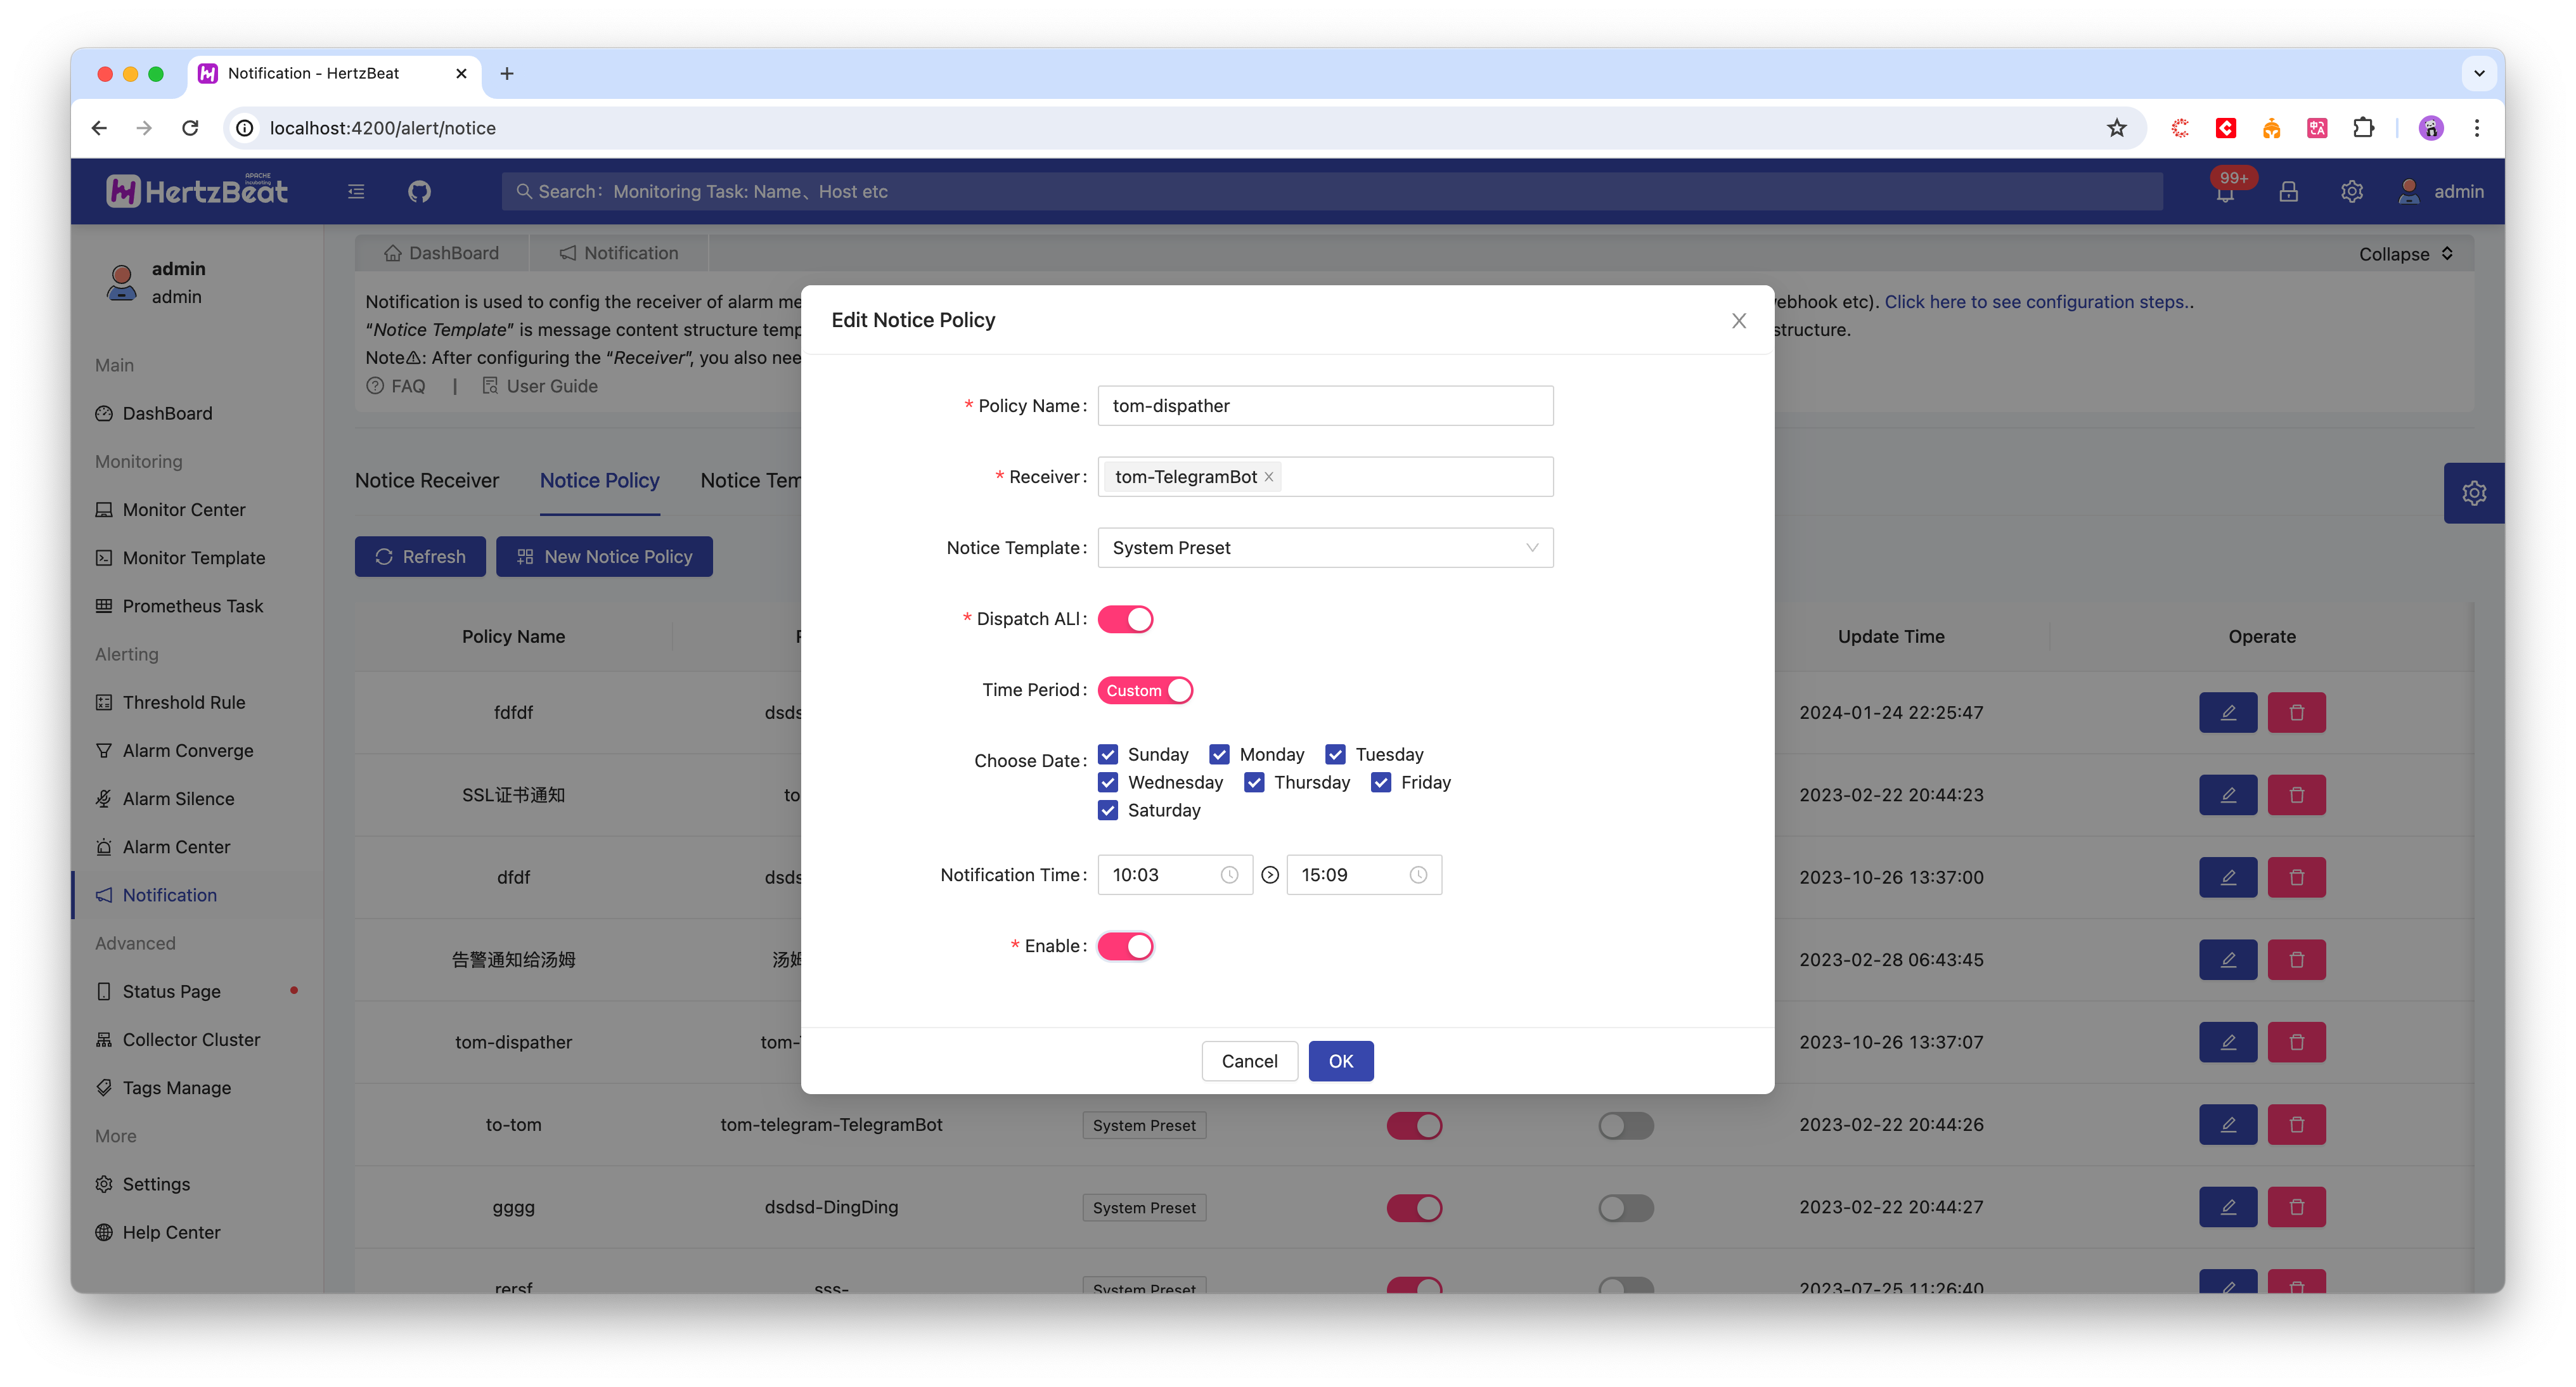
- It includes recipient information management and notification policy management. Recipient management maintains the information of recipients and their notification methods, while notification policy management maintains the policy rules of which recipients will be notified of the alert messages.
- Notification methods support
EmailDiscordSlackTelegramPinningWeChatFlybookSMSWebhookand so on. - The notification policy supports tag matching and alert level matching, which makes it convenient to assign alerts with different tags and alert levels to different receivers and handlers.
- Support notification templates, users can customize the content format of the templates to meet their own personalized notification display needs.
Monitoring Templates
- HertzBeat makes
Http, Jmx, Ssh, Snmp, Jdbc, Prometheusand other protocols configurable so that you can customize the metrics you want to collect using these protocols by simply configuring the monitoring templateYMLin your browser. Would you believe that you can instantly adapt a new monitoring type such asK8sorDockerjust by configuring it? - All our built-in monitoring types (mysql, website, jvm, k8s) are also mapped to corresponding monitoring templates, so you can add and modify monitoring templates to customize your monitoring functions.
There's so much more to discover. Have Fun!