Grafana Dashboard
Grafanais an open source visualization and analytics platform that helps you easily create, share and monitor dashboards. In this article, we will cover how to useGrafanato display historical data inHertzBeat.
Prerequisites
- We recommend using the latest version of Grafana. Earlier versions may not support the exposed API.
- The
Grafanaservice is started and the account password is configured. - The
HertzBeatservice is started and theVictoriaMetricstime-series database is configured (note: theVictoriaMetricsdata source is required).
Grafana can only show historical data for Prometheus type of monitoring, currently it does not support monitoring data defined by yml in HertzBeat.
Enable Grafana embedded features and configure anonymous authentication with role-based permissions
ref: https://grafana.com/blog/2023/10/10/how-to-embed-grafana-dashboards-into-web-applications/.
In the Grafana configuration file grafana.ini, set the configuration parameters.
Or run Grafana via Docker.
Modify the following configuration parameters in the Grafana configuration file grafana.ini:
[auth.proxy]
enabled = true

[auth.anonymous]
enabled = true
org_role = Admin

[users]
viewers_can_edit = true

[security]
allow_embedding = true
Or run Grafana via Docker using the following command:
docker run -d -p 3000:3000 --name=grafana \
  -v "$PWD/data:/var/lib/grafana" \
  -e "GF_AUTH_PROXY_ENABLED=true" \
  -e "GF_AUTH_ANONYMOUS_ENABLED=true" \
  -e "GF_AUTH_ANONYMOUS_ORG_ROLE=Admin" \
  -e "GF_USERS_VIEWERS_CAN_EDIT=true" \
  -e "GF_SECURITY_ALLOW_EMBEDDING=true" \
  grafana/grafana:latest
Configuring Grafana in HertzBeat
In the configuration file application.yml in HertzBeat, configure the Grafana data source.
grafana:
  enabled: true
  url: http://127.0.0.1:3000
  username: admin
  password: admin
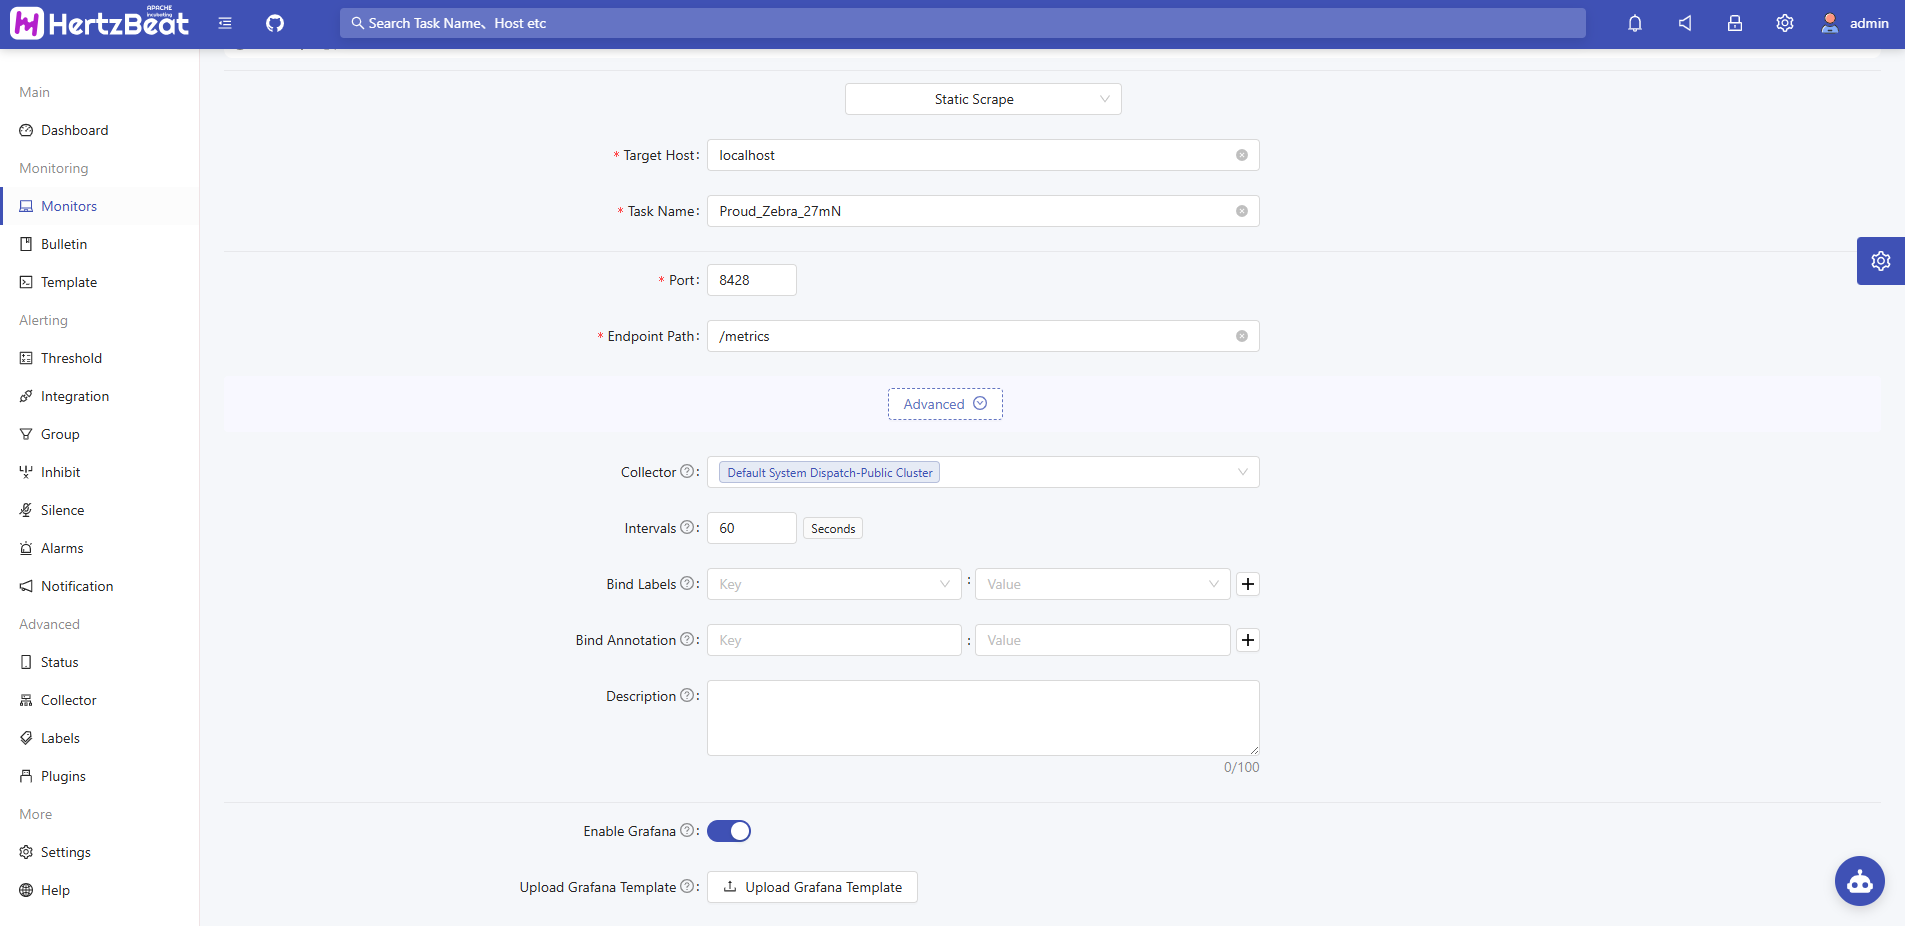
Upload Grafana monitor template json file in HertzBeat monitor
In HertzBeat, when creating or editing a Prometheus type monitor, click Enable Grafana Templates and select the Grafana template json file to upload.
The monitor template json file can be downloaded at https://grafana.com/grafana/dashboards/.
For example, create a new monitor in HertzBeat for VictoriaMetrics single node, then open https://grafana.com/grafana/dashboards/10229-victoriametrics-single-node/, click Download JSON button on the right side. Download JSON button on the right to download the template json file. Upload the template json file in the HertzBeat monitor, save it.
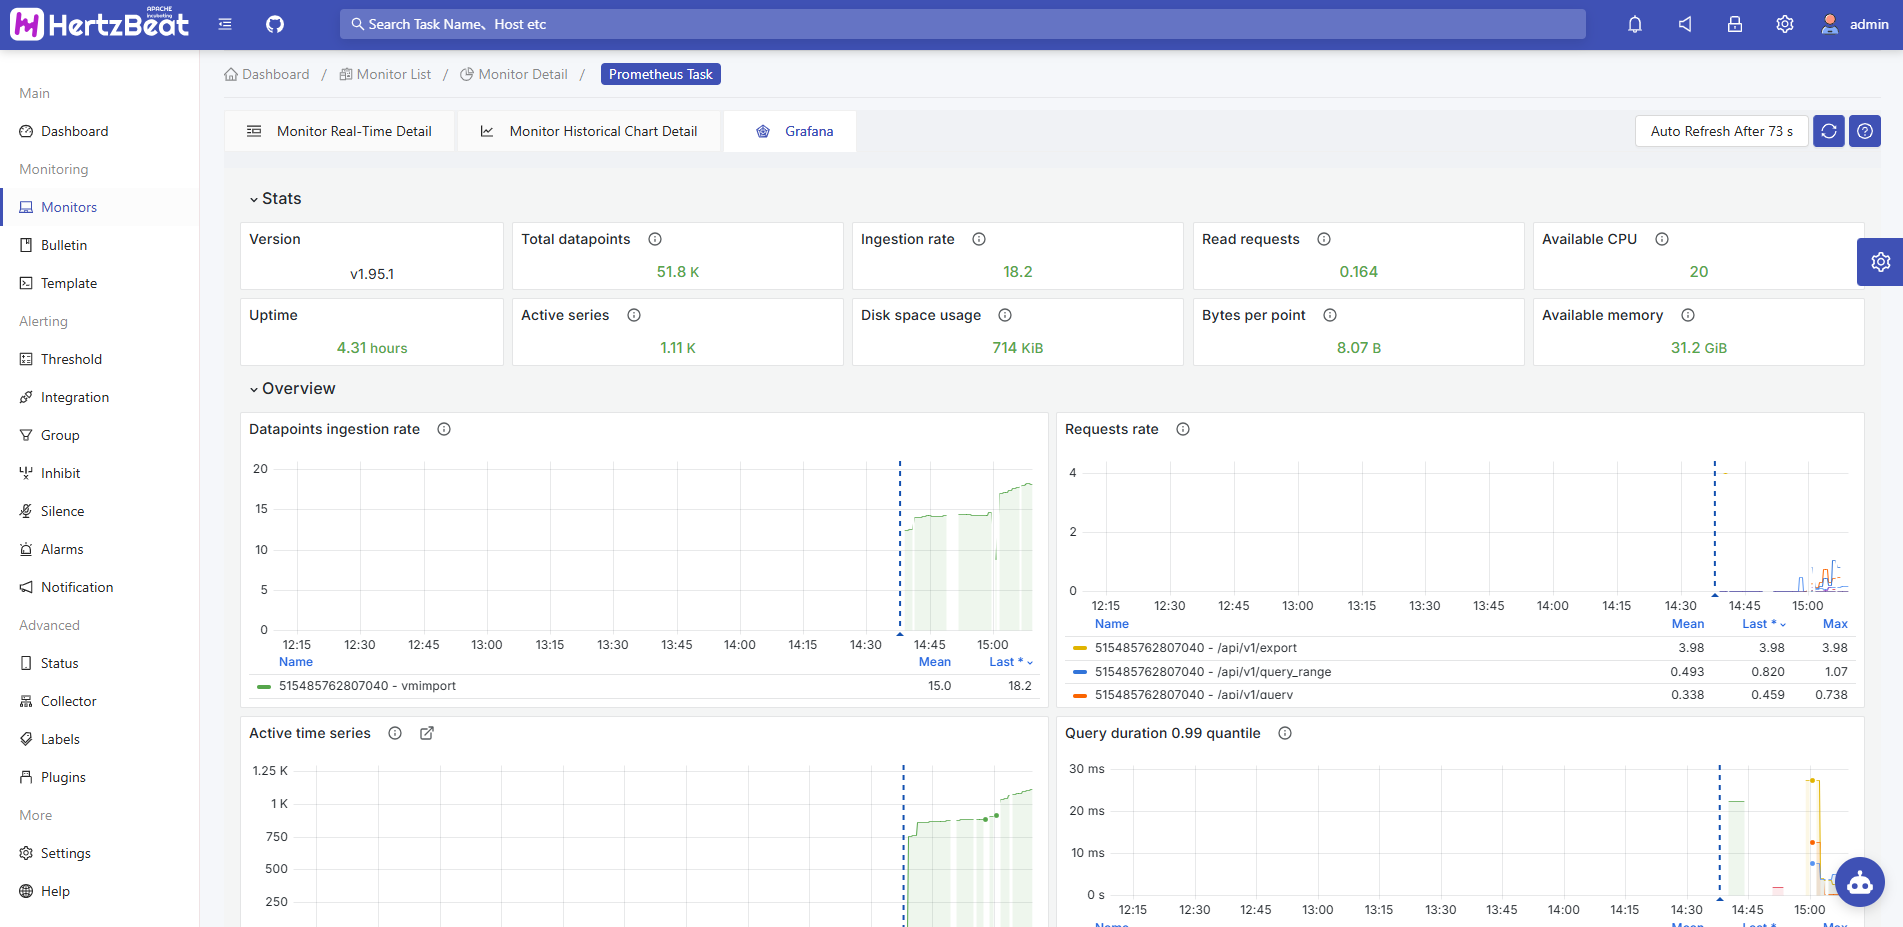
View Grafana historical charts
On the HertzBeat monitoring page, click the Grafana button, select Grafana Historical Charts, select a monitoring template, and click the Query button to view the Grafana historical charts.