Alarm Threshold Configuration
Alarm Threshold are the core function of HertzBeat, users can configure the trigger conditions of the alarm through the threshold rules.
Threshold rules support real-time threshold and scheduled threshold, and can be applied to monitoring metrics and log data data types. Real-time thresholds can directly trigger alerts when monitoring data is collected, and scheduled thresholds support PromQL, SQL and other expressions to calculate trigger alerts within a specified time period.
Support visual page configuration or more flexible expression rule configuration, support configuring trigger times, alarm levels, notification templates, associated specified monitoring and so on. Notification templates support object nested access, which can display alarm information more flexibly.
Real-time Threshold
Real-time threshold means that the alarm is triggered directly when the monitoring data is collected, which is suitable for scenarios with high real-time requirements. Supports both monitoring metrics and log data types.
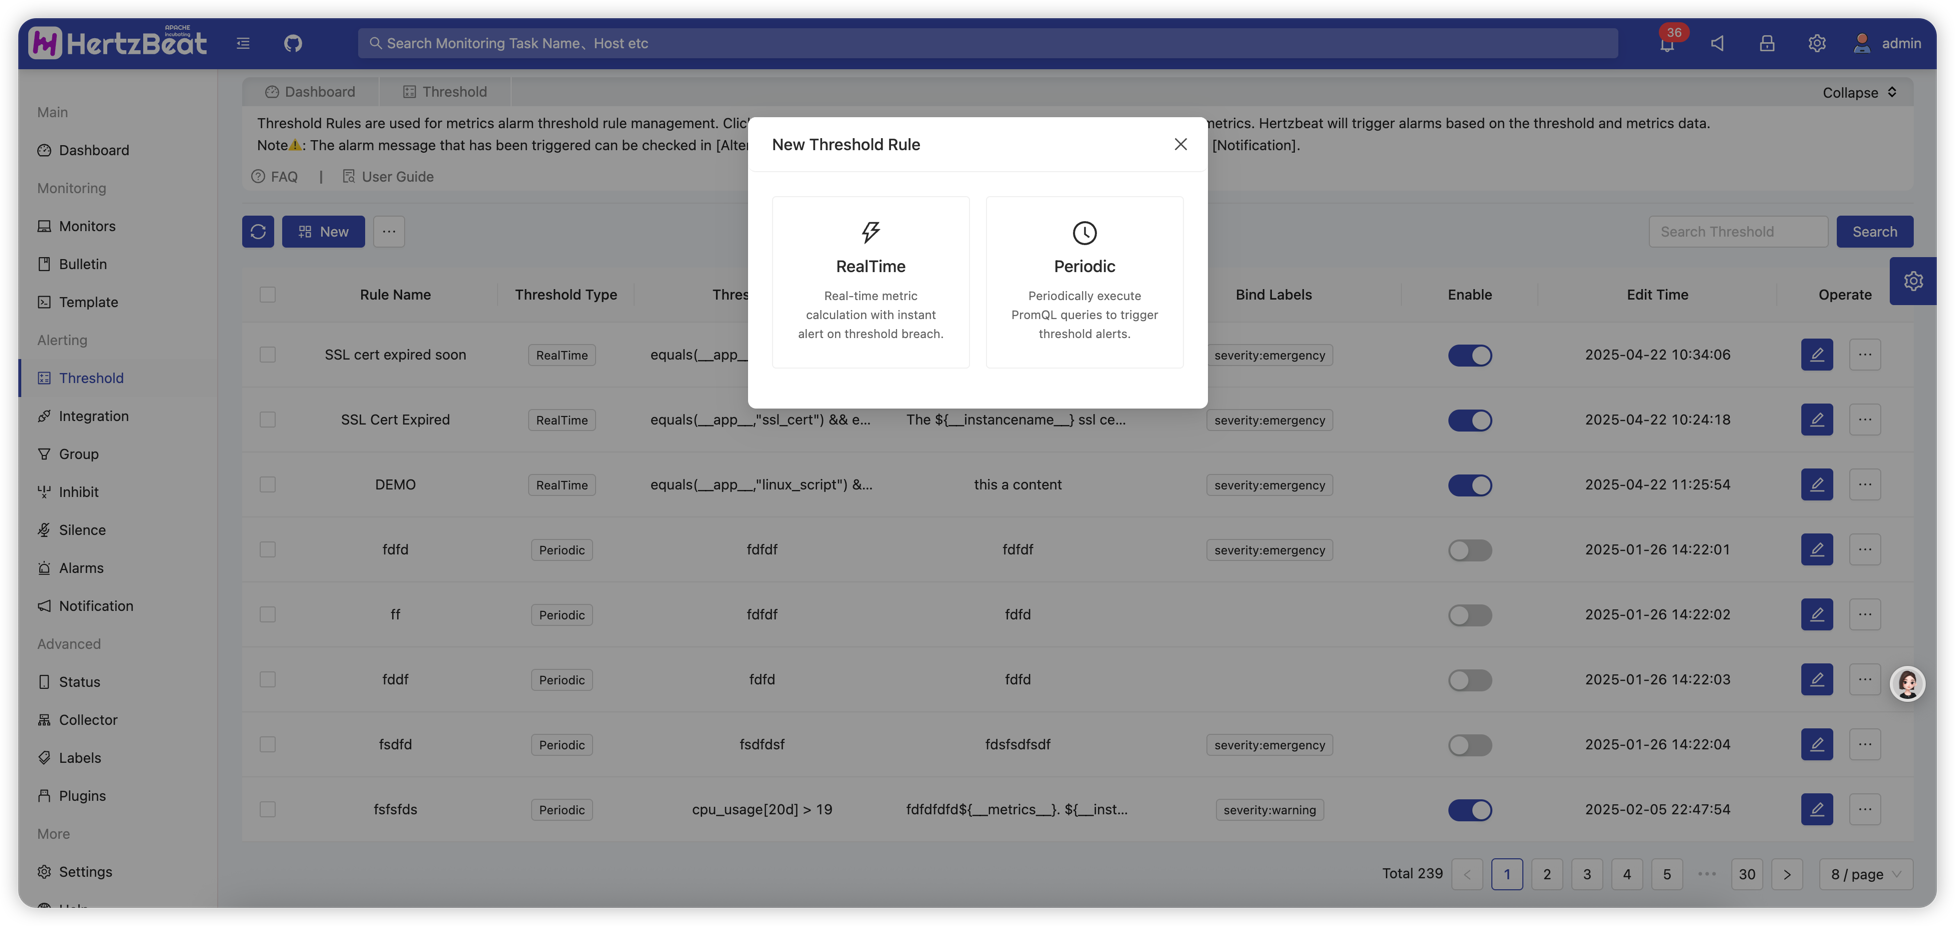
Creating Real-time Threshold Rules
System Page -> Alerting -> Alert Threshold -> New Threshold -> Select Real-time Threshold -> Select Data Type (Monitoring Metrics/Log Data)
Monitoring Metrics Real-time Threshold
HertzBeat Page -> Alerting -> Threshold -> New Threshold -> ReadTime Threshold Rule
Configure the threshold, for example: Select the SSL certificate metric object, configure the alarm expression-triggered when the metric expired is true, that is, equals(expired,"true"), set the alarm level notification template information, etc.
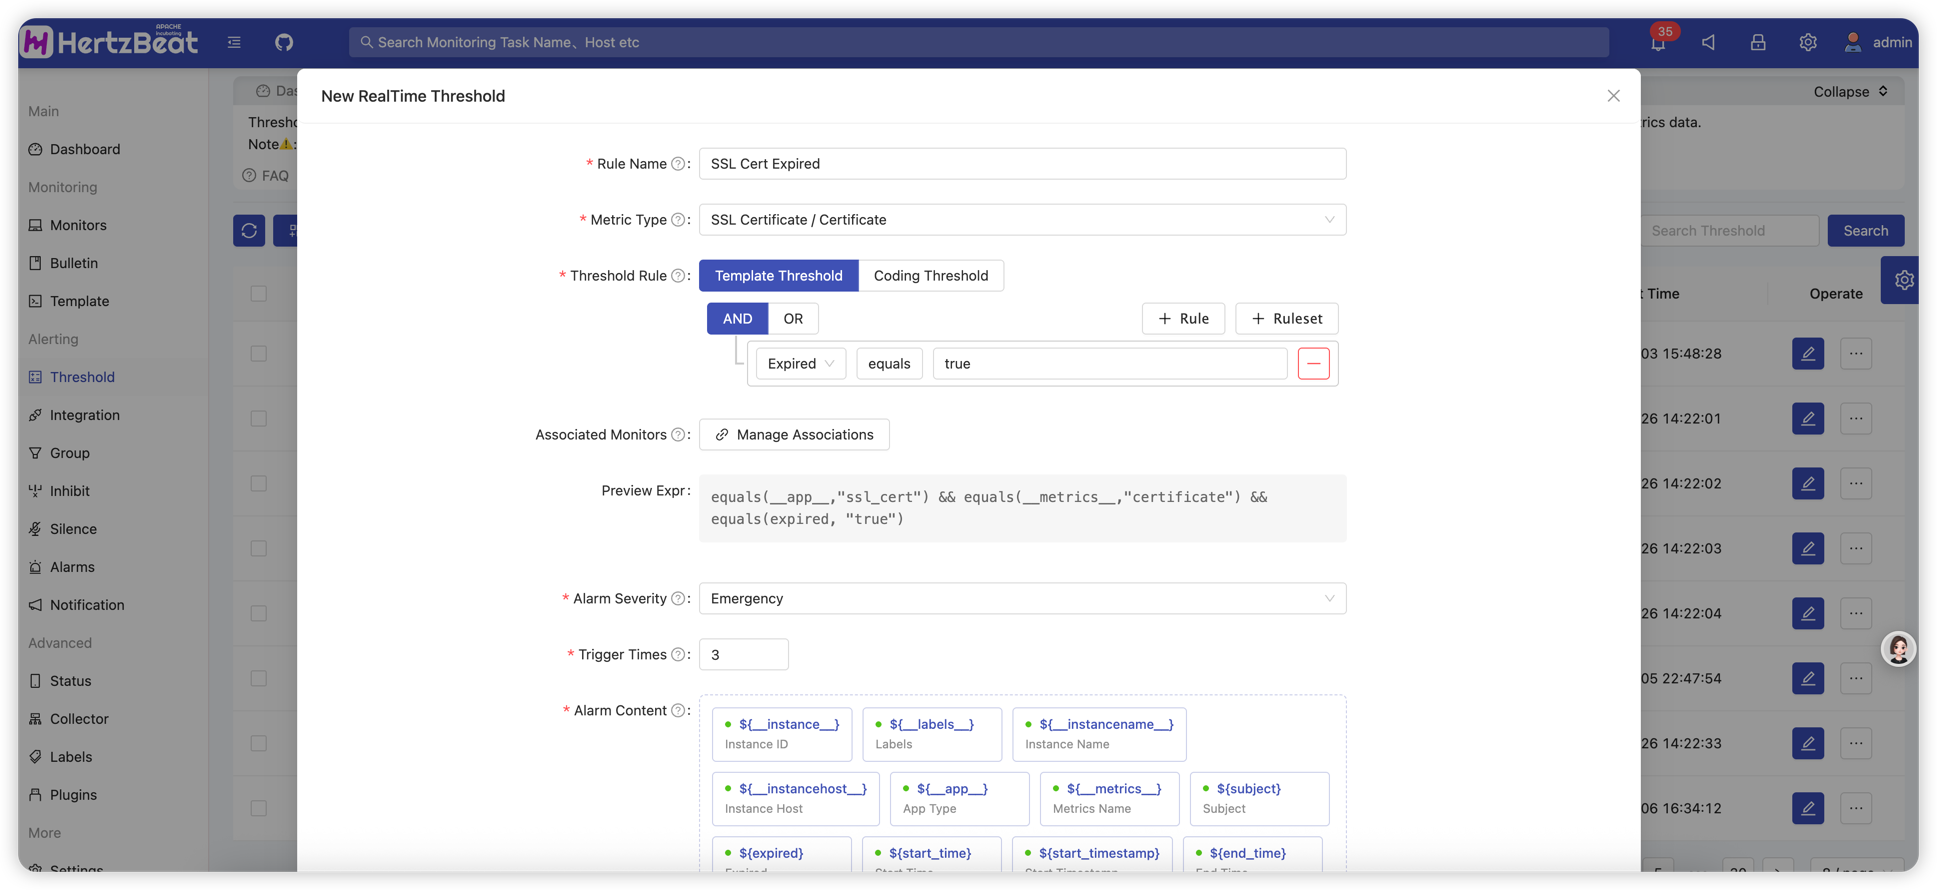
Configuration item details:
- Threshold Name: Unique name defining this threshold rule
- Data Type: Select monitoring metrics or log data
- Metric Object: Select the monitoring metric object for which we need to configure the threshold. For example: Under website monitoring type -> response time metric
- Threshold Rule: Configure the alarm trigger rules for specific indicators, support graphical interface and expression rules. For expression environment variables and operators, see the page prompts. For detailed help on threshold expressions, see Threshold Expression Help
- Associated Monitors: Apply this threshold rule to the specified monitoring object (support direct binding and label association). If not configured, it will be applied to all monitoring objects that meet this threshold type rule
- Alert Level: The alert level triggered by the threshold, from low to high: warning, critical, emergency
- Trigger Count: Set how many times the threshold must be triggered before the alert is actually triggered
- Notification Template: The template for the notification message sent after the alert is triggered. Template variables are provided on the page, supports object nested access. For example:
__instancename__, metric value isresponseTime, which is greater than 50 triggering the alert, also supports accessing object properties like${log.attributes.hostname} - Additional Labels: Add labels to this threshold rule. When an alert is generated, these labels will also be attached to the alert
- Additional Annotations: Add annotation information to this threshold rule (the annotation content supports environment variables). When an alarm is generated, this annotation information will be rendered and attached to the alarm
- Enable Alert: Enable or disable this alert threshold configuration
Log Data Real-time Threshold
Configure real-time alert rules for log data, supporting condition judgment on log content, attributes, resource information, etc.
For example, trigger an alert when 60 error logs are received within 300 seconds.

Configuration item details:
- Threshold Name: Unique name defining this threshold rule
- Data Type: Select log data
- Threshold Rule: Configure log alert trigger rules, support graphical interface and expression rules:
- Graphical Interface: Visual configuration of log field conditions, supports
log.level,log.message,log.attributes.*,log.resource.*and other fields - Expression Rules: Use custom expressions, supports object nested access, for example:
equals(log.level,"ERROR")orcontains(log.attributes.hostname,"server-01")
- Graphical Interface: Visual configuration of log field conditions, supports
- Time Window: Set the time window for log aggregation, in seconds, minimum 60 seconds. Logs within this time window will be aggregated and processed
- Alert Level: The alert level triggered by the threshold, from low to high: warning, critical, emergency
- Alert Mode: Select alert sending method:
- Window Group Mode (group): Send all logs that meet the conditions within the time window as one alert
- Individual Mode (individual): Send each log that meets the conditions as a separate alert
- Trigger Count: Set how many logs that meet the conditions within the time window will trigger the alert
- Notification Template: The template for the notification message sent after the alert is triggered, supports object nested access:
- Basic variables:
__instancename__,__alertname__, etc. - Log fields:
${log.level},${log.message},${log.timestamp}, etc. - Nested attributes:
${log.attributes.hostname},${log.resource.service.name}, etc.
- Basic variables:
- Additional Labels: Add labels to this threshold rule. When an alert is generated, these labels will also be attached to the alert
- Additional Annotations: Add annotation information to this threshold rule (the annotation content supports environment variables). When an alarm is generated, this annotation information will be rendered and attached to the alarm
- Enable Alert: Enable or disable this alert threshold configuration
The threshold alert configuration is complete, and alerts that have been successfully triggered can be viewed in the [Alarm Center]. If you need to send alert notifications via email, WeChat, DingTalk, or Feishu, you can configure it in [Notification].
Scheduled Threshold
Scheduled Threshold Rules refer to rules where the system evaluates an expression (such as PromQL, SQL) at specified periodic intervals to determine whether monitoring data or log data within a given time range meets alert conditions. These rules are suitable for scenarios requiring trend analysis or aggregated data evaluation, rather than immediate reactions to single real-time data points. Supports both monitoring metrics and log data types.
Syntax for Scheduled Threshold Expressions
Scheduled threshold rules use a dedicated expression language based on ANTLR syntax, supporting different query syntax based on data type:
Monitoring Metrics Expression Syntax (PromQL)
Supports PromQL-style queries. For specific syntax, please refer to the official documentation of your configured time-series database regarding PromQL. The syntax includes:
-
Query Expressions: Used to reference monitoring data
    cpu_usage
memory{__field__="field1"} -
Comparison Expressions: Used to compare values against thresholds
    cpu_usage > 80
    memory_usage >= 90.5
response_time < 1000 -
Logical Expressions: Used to combine multiple conditions
    cpu_usage > 80 and memory_usage > 70
    disk_usage > 90 or inode_usage > 85
cpu_usage > 80 unless maintenance_mode == 1 -
Parenthesis Expressions: Used to control the order of evaluation
(cpu_usage > 80 or memory_usage > 90) and service_status == 1
Log Data Expression Syntax (SQL)
Supports standard SQL syntax to query log data and filter data, allowing aggregated queries on log tables:
-- Query error log count
SELECT COUNT(*) as error_count
FROM hertzbeat_logs
WHERE level = 'ERROR'
AND timestamp >= NOW() - INTERVAL 5 MINUTE

-- Group by service to count errors
SELECT service_name, COUNT(*) as error_count
FROM hertzbeat_logs
WHERE level = 'ERROR'
GROUP BY service_name
HAVING COUNT(*) > 10
Creating Scheduled Threshold Rules
System Page -> Alerting -> Alert Threshold -> New Threshold -> Select Scheduled Threshold -> Select Data Type (Monitoring Metrics/Log Data)
Monitoring Metrics Scheduled Threshold
Configure scheduled thresholds for monitoring metrics. For example: define the expression cpu_usage{instance="server1"} > 80` for a group of CPU metrics, and trigger an alert when the expression is satisfied.
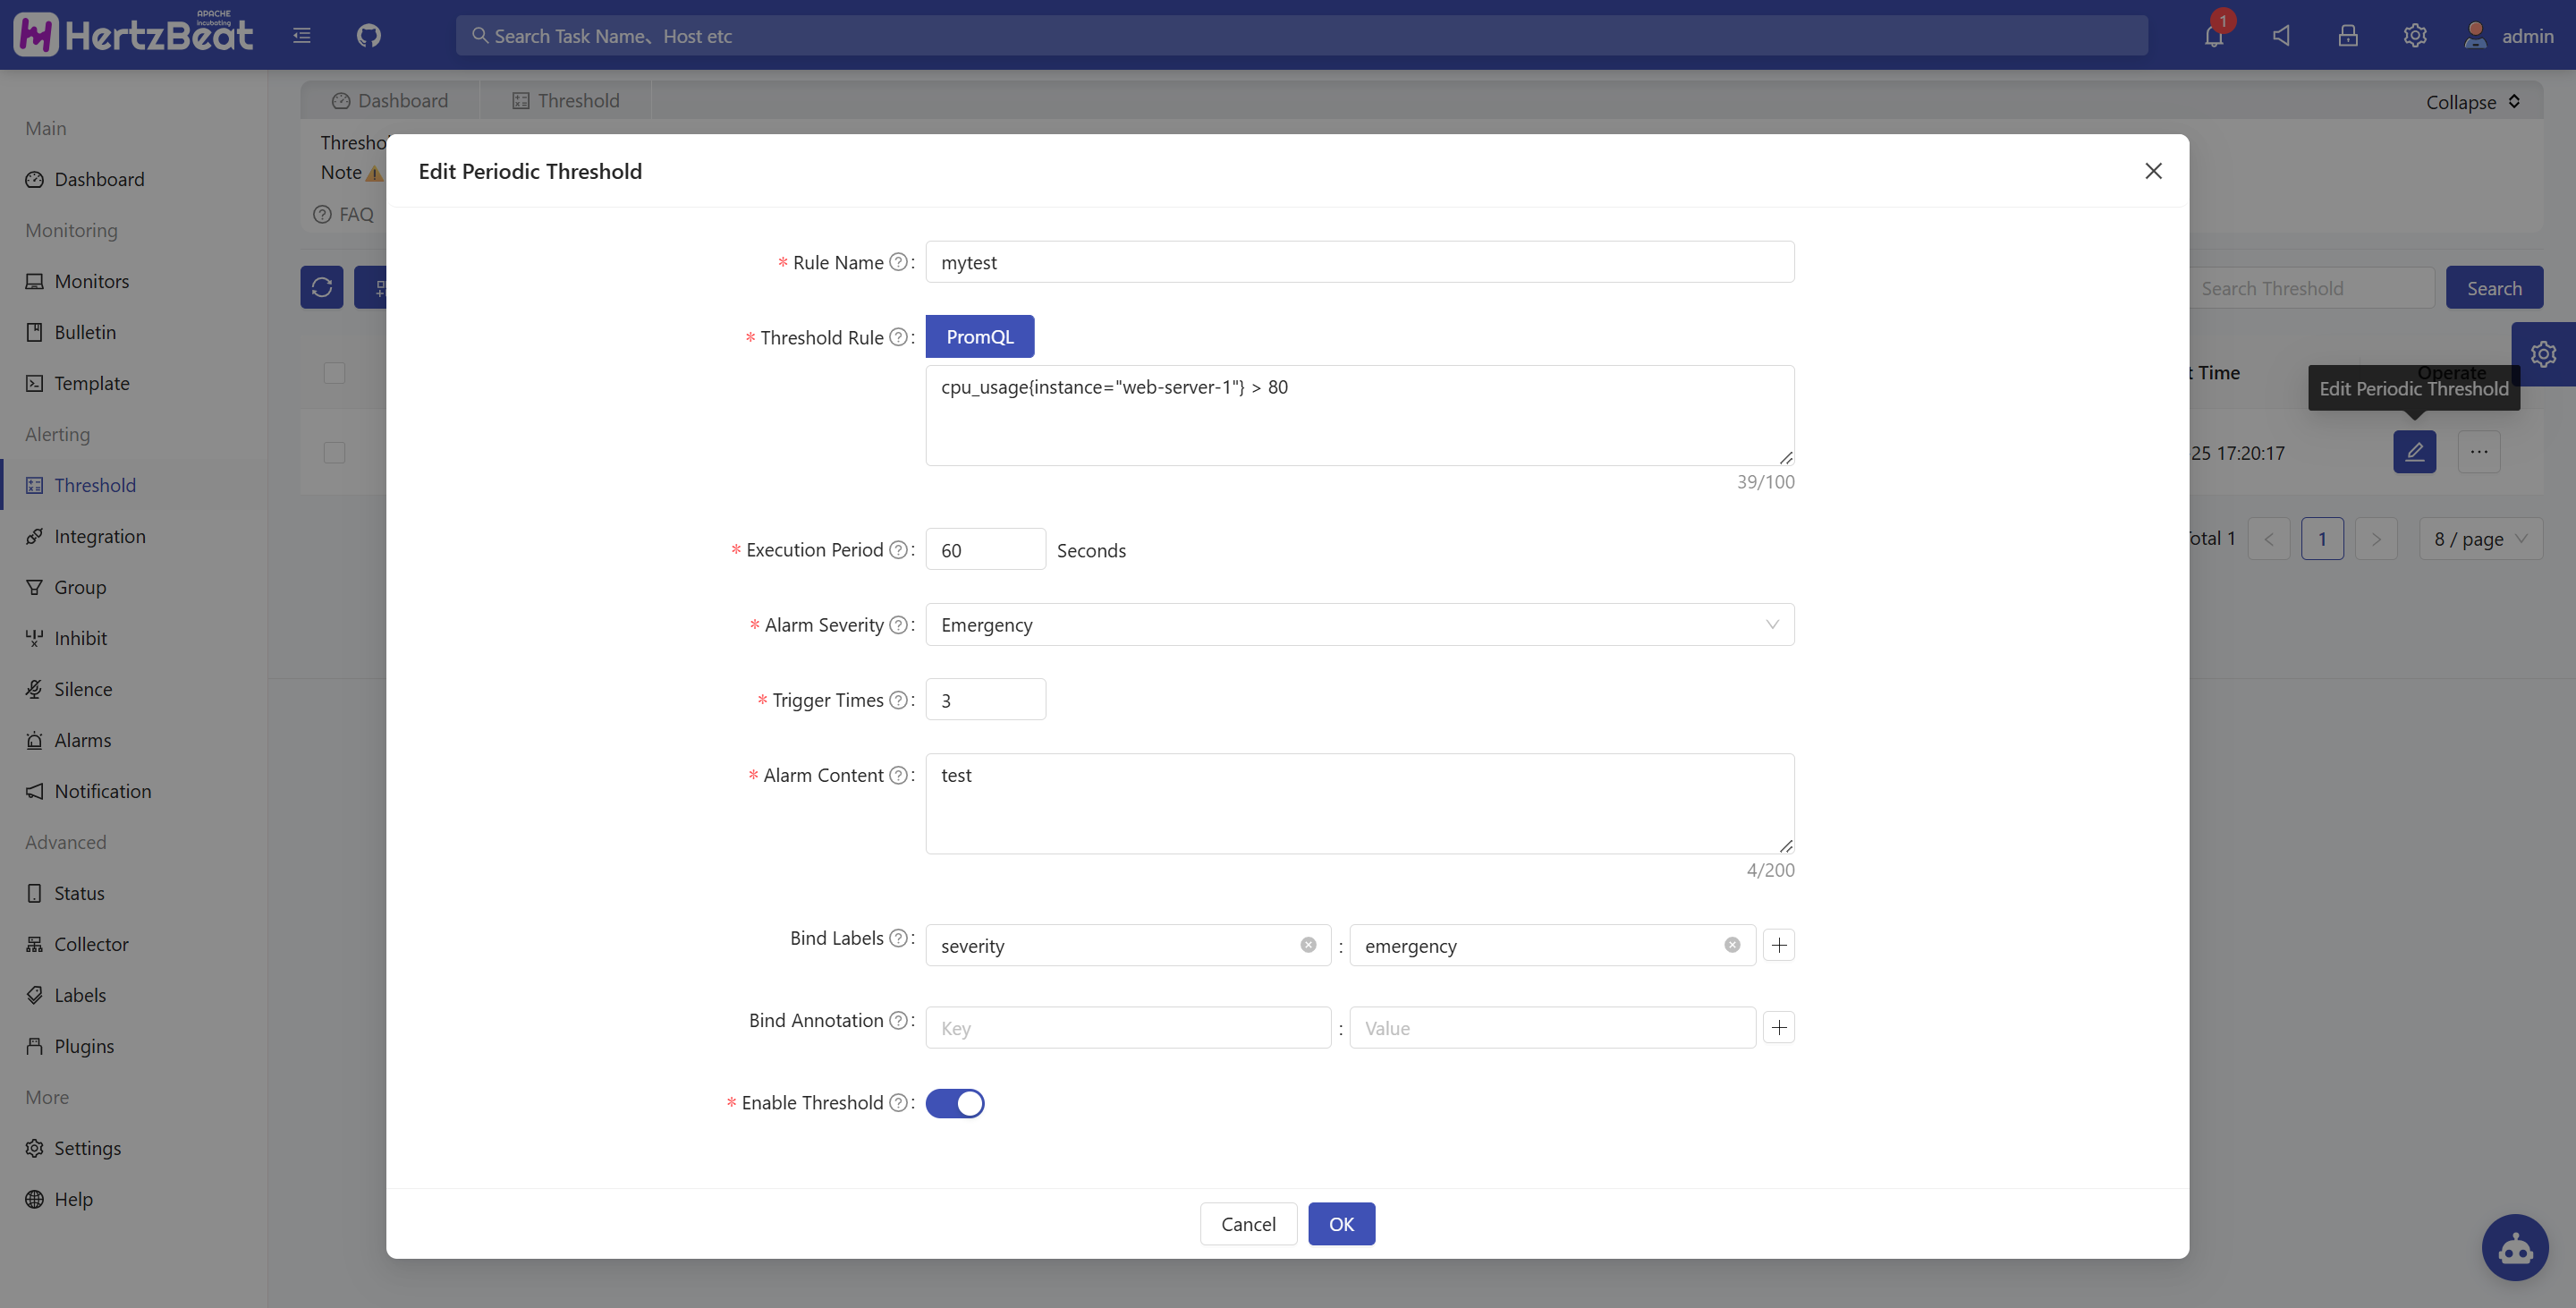
Configuration Items Explained:
- Rule Name: A unique identifier for the threshold rule
- Data Type: Select monitoring metrics
- Query Language: Select PromQL as the query language
- Threshold Expression: The expression that defines the alert condition. It will be evaluated periodically according to the "Execution Interval". Supported elements include:
- Query Identifiers: References to monitoring metrics (e.g.,
cpu_usage,memory{instance="server1"}) - Comparison Operators:
>,>=,<,<=,==,!= - Logical Operators:
and,or,unless - Parentheses: Used for grouping and controlling evaluation order
- Numeric Literals: Threshold values (e.g.,
80,90.5)
- Query Identifiers: References to monitoring metrics (e.g.,
- Execution Interval: The time interval (in seconds) at which the expression is evaluated. For example,
300means the rule is checked every 5 minutes - Alert Level: The severity level triggered when the condition is met. Available levels:
warning,critical,emergency - Trigger Count: The number of consecutive times the expression must evaluate to true before an alert is actually triggered
- Notification Template: The message template sent when an alert is triggered. Template variables are available on the configuration page, supports object nested access
- Additional Labels: Custom labels that will be attached to the alert when it is generated
- Additional Annotations: Custom annotation information (supports environment variables) that will be rendered and attached to the alert
- Enable Alerting: Controls whether this threshold rule is active or not
Log Data Scheduled Threshold
Configure scheduled thresholds for log data, performing aggregated analysis and alert judgment on logs through SQL queries.

Configuration Items Explained:
- Rule Name: A unique identifier for the threshold rule
- Data Type: Select log data
- Query Language: Select SQL as the query language
- Log Query Expression: Use standard SQL syntax to query log data, supporting aggregation functions, grouping, filtering and other operations. For example:
SELECT COUNT(*) as error_count FROM hertzbeat_logs
WHERE level = 'ERROR' AND timestamp >= NOW() - INTERVAL 5 MINUTE
- Execution Interval: The time interval (in seconds) at which the SQL query is executed. For example,
300means the query is executed every 5 minutes - Alert Level: The severity level triggered when the condition is met. Available levels:
warning,critical,emergency - Alert Mode: Select alert sending method:
- Window Group Mode (group): Send the query result as a single alert
- Individual Mode (individual): Send each row in the query result as a separate alert
- Trigger Count: The number of consecutive times the query result meets the alert condition before an alert is actually triggered
- Notification Template: The message template sent when an alert is triggered, supports accessing fields in the query result, for example:
- Query result fields:
error_count,service_name, etc. - Basic variables:
__alertname__,__severity__, etc.
- Query result fields:
- Additional Labels: Custom labels that will be attached to the alert when it is generated
- Additional Annotations: Custom annotation information (supports environment variables) that will be rendered and attached to the alert
- Enable Alerting: Controls whether this threshold rule is active or not
Once the threshold rules are configured, successfully triggered alerts will be displayed in the [Alert Center]. To send alert notifications via Email, WeChat, DingTalk, or Feishu, please go to [Notification Configuration] to set up the appropriate channels.